Data & Finance for Work & Life


Data Analysis for Qualitative Research: 6 Step Guide
Data analysis for qualitative research is not intuitive. This is because qualitative data stands in opposition to traditional data analysis methodologies: while data analysis is concerned with quantities, qualitative data is by definition unquantified . But there is an easy, methodical approach that anyone can take use to get reliable results when performing data analysis for qualitative research. The process consists of 6 steps that I’ll break down in this article:
- Perform interviews(if necessary )
- Gather all documents and transcribe any non-paper records
- Decide whether to either code analytical data, analyze word frequencies, or both
- Decide what interpretive angle you want to take: content analysis , narrative analysis, discourse analysis, framework analysis, and/or grounded theory
- Compile your data in a spreadsheet using document saving techniques (windows and mac)
- Identify trends in words, themes, metaphors, natural patterns, and more
To complete these steps, you will need:
- Microsoft word
- Microsoft excel
- Internet access
You can get the free Intro to Data Analysis eBook to cover the fundamentals and ensure strong progression in all your data endeavors.
What is qualitative research?
Qualitative research is not the same as quantitative research. In short, qualitative research is the interpretation of non-numeric data. It usually aims at drawing conclusions that explain why a phenomenon occurs, rather than that one does occur. Here’s a great quote from a nursing magazine about quantitative vs qualitative research:
“A traditional quantitative study… uses a predetermined (and auditable) set of steps to confirm or refute [a] hypothesis. “In contrast, qualitative research often takes the position that an interpretive understanding is only possible by way of uncovering or deconstructing the meanings of a phenomenon. Thus, a distinction between explaining how something operates (explanation) and why it operates in the manner that it does (interpretation) may be [an] effective way to distinguish quantitative from qualitative analytic processes involved in any particular study.” (bold added) (( EBN ))
Learn to Interpret Your Qualitative Data
This article explain what data analysis is and how to do it. To learn how to interpret the results, visualize, and write an insightful report, sign up for our handbook below.

Step 1a: Data collection methods and techniques in qualitative research: interviews and focus groups
Step 1 is collecting the data that you will need for the analysis. If you are not performing any interviews or focus groups to gather data, then you can skip this step. It’s for people who need to go into the field and collect raw information as part of their qualitative analysis.
Since the whole point of an interview and of qualitative analysis in general is to understand a research question better, you should start by making sure you have a specific, refined research question . Whether you’re a researcher by trade or a data analyst working on one-time project, you must know specifically what you want to understand in order to get results.
Good research questions are specific enough to guide action but open enough to leave room for insight and growth. Examples of good research questions include:
- Good : To what degree does living in a city impact the quality of a person’s life? (open-ended, complex)
- Bad : Does living in a city impact the quality of a person’s life? (closed, simple)
Once you understand the research question, you need to develop a list of interview questions. These questions should likewise be open-ended and provide liberty of expression to the responder. They should support the research question in an active way without prejudicing the response. Examples of good interview questions include:
- Good : Tell me what it’s like to live in a city versus in the country. (open, not leading)
- Bad : Don’t you prefer the city to the country because there are more people? (closed, leading)
Some additional helpful tips include:
- Begin each interview with a neutral question to get the person relaxed
- Limit each question to a single idea
- If you don’t understand, ask for clarity
- Do not pass any judgements
- Do not spend more than 15m on an interview, lest the quality of responses drop
Focus groups
The alternative to interviews is focus groups. Focus groups are a great way for you to get an idea for how people communicate their opinions in a group setting, rather than a one-on-one setting as in interviews.
In short, focus groups are gatherings of small groups of people from representative backgrounds who receive instruction, or “facilitation,” from a focus group leader. Typically, the leader will ask questions to stimulate conversation, reformulate questions to bring the discussion back to focus, and prevent the discussion from turning sour or giving way to bad faith.
Focus group questions should be open-ended like their interview neighbors, and they should stimulate some degree of disagreement. Disagreement often leads to valuable information about differing opinions, as people tend to say what they mean if contradicted.
However, focus group leaders must be careful not to let disagreements escalate, as anger can make people lie to be hurtful or simply to win an argument. And lies are not helpful in data analysis for qualitative research.
Step 1b: Tools for qualitative data collection
When it comes to data analysis for qualitative analysis, the tools you use to collect data should align to some degree with the tools you will use to analyze the data.
As mentioned in the intro, you will be focusing on analysis techniques that only require the traditional Microsoft suite programs: Microsoft Excel and Microsoft Word . At the same time, you can source supplementary tools from various websites, like Text Analyzer and WordCounter.
In short, the tools for qualitative data collection that you need are Excel and Word , as well as web-based free tools like Text Analyzer and WordCounter . These online tools are helpful in the quantitative part of your qualitative research.
Step 2: Gather all documents & transcribe non-written docs
Once you have your interviews and/or focus group transcripts, it’s time to decide if you need other documentation. If you do, you’ll need to gather it all into one place first, then develop a strategy for how to transcribe any non-written documents.
When do you need documentation other than interviews and focus groups? Two situations usually call for documentation. First , if you have little funding , then you can’t afford to run expensive interviews and focus groups.
Second , social science researchers typically focus on documents since their research questions are less concerned with subject-oriented data, while hard science and business researchers typically focus on interviews and focus groups because they want to know what people think, and they want to know today.
Non-written records
Other factors at play include the type of research, the field, and specific research goal. For those who need documentation and to describe non-written records, there are some steps to follow:
- Put all hard copy source documents into a sealed binder (I use plastic paper holders with elastic seals ).
- If you are sourcing directly from printed books or journals, then you will need to digitalize them by scanning them and making them text readable by the computer. To do so, turn all PDFs into Word documents using online tools such as PDF to Word Converter . This process is never full-proof, and it may be a source of error in the data collection, but it’s part of the process.
- If you are sourcing online documents, try as often as possible to get computer-readable PDF documents that you can easily copy/paste or convert. Locked PDFs are essentially a lost cause .
- Transcribe any audio files into written documents. There are free online tools available to help with this, such as 360converter . If you run a test through the system, you’ll see that the output is not 100%. The best way to use this tool is as a first draft generator. You can then correct and complete it with old fashioned, direct transcription.
Step 3: Decide on the type of qualitative research
Before step 3 you should have collected your data, transcribed it all into written-word documents, and compiled it in one place. Now comes the interesting part. You need to decide what you want to get out of your research by choosing an analytic angle, or type of qualitative research.
The available types of qualitative research are as follows. Each of them takes a unique angle that you must choose to get what information you want from the analysis . In addition, each of them has a different impact on the data analysis for qualitative research (coding vs word frequency) that we use.
Content analysis
Narrative analysis, discourse analysis.
- Framework analysis, and/or
Grounded theory
From a high level, content, narrative, and discourse analysis are actionable independent tactics, whereas framework analysis and grounded theory are ways of honing and applying the first three.
- Definition : Content analysis is identify and labelling themes of any kind within a text.
- Focus : Identifying any kind of pattern in written text, transcribed audio, or transcribed video. This could be thematic, word repetition, idea repetition. Most often, the patterns we find are idea that make up an argument.
- Goal : To simplify, standardize, and quickly reference ideas from any given text. Content analysis is a way to pull the main ideas from huge documents for comparison. In this way, it’s more a means to an end.
- Pros : The huge advantage of doing content analysis is that you can quickly process huge amounts of texts using simple coding and word frequency techniques we will look at below. To use a metaphore, it is to qualitative analysis documents what Spark notes are to books.
- Cons : The downside to content analysis is that it’s quite general. If you have a very specific, narrative research question, then tracing “any and all ideas” will not be very helpful to you.
- Definition : Narrative analysis is the reformulation and simplification of interview answers or documentation into small narrative components to identify story-like patterns.
- Focus : Understanding the text based on its narrative components as opposed to themes or other qualities.
- Goal : To reference the text from an angle closer to the nature of texts in order to obtain further insights.
- Pros : Narrative analysis is very useful for getting perspective on a topic in which you’re extremely limited. It can be easy to get tunnel vision when you’re digging for themes and ideas from a reason-centric perspective. Turning to a narrative approach will help you stay grounded. More importantly, it helps reveal different kinds of trends.
- Cons : Narrative analysis adds another layer of subjectivity to the instinctive nature of qualitative research. Many see it as too dependent on the researcher to hold any critical value.
- Definition : Discourse analysis is the textual analysis of naturally occurring speech. Any oral expression must be transcribed before undergoing legitimate discourse analysis.
- Focus : Understanding ideas and themes through language communicated orally rather than pre-processed on paper.
- Goal : To obtain insights from an angle outside the traditional content analysis on text.
- Pros : Provides a considerable advantage in some areas of study in order to understand how people communicate an idea, versus the idea itself. For example, discourse analysis is important in political campaigning. People rarely vote for the candidate who most closely corresponds to his/her beliefs, but rather for the person they like the most.
- Cons : As with narrative analysis, discourse analysis is more subjective in nature than content analysis, which focuses on ideas and patterns. Some do not consider it rigorous enough to be considered a legitimate subset of qualitative analysis, but these people are few.
Framework analysis
- Definition : Framework analysis is a kind of qualitative analysis that includes 5 ordered steps: coding, indexing, charting, mapping, and interpreting . In most ways, framework analysis is a synonym for qualitative analysis — the same thing. The significant difference is the importance it places on the perspective used in the analysis.
- Focus : Understanding patterns in themes and ideas.
- Goal : Creating one specific framework for looking at a text.
- Pros : Framework analysis is helpful when the researcher clearly understands what he/she wants from the project, as it’s a limitation approach. Since each of its step has defined parameters, framework analysis is very useful for teamwork.
- Cons : It can lead to tunnel vision.
- Definition : The use of content, narrative, and discourse analysis to examine a single case, in the hopes that discoveries from that case will lead to a foundational theory used to examine other like cases.
- Focus : A vast approach using multiple techniques in order to establish patterns.
- Goal : To develop a foundational theory.
- Pros : When successful, grounded theories can revolutionize entire fields of study.
- Cons : It’s very difficult to establish ground theories, and there’s an enormous amount of risk involved.
Step 4: Coding, word frequency, or both
Coding in data analysis for qualitative research is the process of writing 2-5 word codes that summarize at least 1 paragraphs of text (not writing computer code). This allows researchers to keep track of and analyze those codes. On the other hand, word frequency is the process of counting the presence and orientation of words within a text, which makes it the quantitative element in qualitative data analysis.
Video example of coding for data analysis in qualitative research
In short, coding in the context of data analysis for qualitative research follows 2 steps (video below):
- Reading through the text one time
- Adding 2-5 word summaries each time a significant theme or idea appears
Let’s look at a brief example of how to code for qualitative research in this video:
Click here for a link to the source text. 1
Example of word frequency processing
And word frequency is the process of finding a specific word or identifying the most common words through 3 steps:
- Decide if you want to find 1 word or identify the most common ones
- Use word’s “Replace” function to find a word or phrase
- Use Text Analyzer to find the most common terms
Here’s another look at word frequency processing and how you to do it. Let’s look at the same example above, but from a quantitative perspective.
Imagine we are already familiar with melanoma and KITs , and we want to analyze the text based on these keywords. One thing we can do is look for these words using the Replace function in word
- Locate the search bar
- Click replace
- Type in the word
- See the total results
Here’s a brief video example:
Another option is to use an online Text Analyzer. This methodology won’t help us find a specific word, but it will help us discover the top performing phrases and words. All you need to do it put in a link to a target page or paste a text. I pasted the abstract from our source text, and what turns up is as expected. Here’s a picture:

Step 5: Compile your data in a spreadsheet
After you have some coded data in the word document, you need to get it into excel for analysis. This process requires saving the word doc as an .htm extension, which makes it a website. Once you have the website, it’s as simple as opening that page, scrolling to the bottom, and copying/pasting the comments, or codes, into an excel document.
You will need to wrangle the data slightly in order to make it readable in excel. I’ve made a video to explain this process and places it below.
Step 6: Identify trends & analyze!
There are literally thousands of different ways to analyze qualitative data, and in most situations, the best technique depends on the information you want to get out of the research.
Nevertheless, there are a few go-to techniques. The most important of this is occurrences . In this short video, we finish the example from above by counting the number of times our codes appear. In this way, it’s very similar to word frequency (discussed above).
A few other options include:
- Ranking each code on a set of relevant criteria and clustering
- Pure cluster analysis
- Causal analysis
We cover different types of analysis like this on the website, so be sure to check out other articles on the home page .
How to analyze qualitative data from an interview
To analyze qualitative data from an interview , follow the same 6 steps for quantitative data analysis:
- Perform the interviews
- Transcribe the interviews onto paper
- Decide whether to either code analytical data (open, axial, selective), analyze word frequencies, or both
- Compile your data in a spreadsheet using document saving techniques (for windows and mac)
- Source text [ ↩ ]
About the Author
Noah is the founder & Editor-in-Chief at AnalystAnswers. He is a transatlantic professional and entrepreneur with 5+ years of corporate finance and data analytics experience, as well as 3+ years in consumer financial products and business software. He started AnalystAnswers to provide aspiring professionals with accessible explanations of otherwise dense finance and data concepts. Noah believes everyone can benefit from an analytical mindset in growing digital world. When he's not busy at work, Noah likes to explore new European cities, exercise, and spend time with friends and family.
File available immediately.
Notice: JavaScript is required for this content.

The Ultimate Guide to Qualitative Research - Part 2: Handling Qualitative Data

- Handling qualitative data
- Transcripts
- Field notes
- Survey data and responses
- Visual and audio data
- Data organization
- Data coding
- Coding frame
- Auto and smart coding
- Organizing codes
- Introduction
What is qualitative data analysis?
Qualitative data analysis methods, how do you analyze qualitative data, content analysis, thematic analysis.
- Thematic analysis vs. content analysis
- Narrative research
Phenomenological research
Discourse analysis, grounded theory.
- Deductive reasoning
- Inductive reasoning
- Inductive vs. deductive reasoning
- Qualitative data interpretation
- Qualitative data analysis software
Qualitative data analysis
Analyzing qualitative data is the next step after you have completed the use of qualitative data collection methods . The qualitative analysis process aims to identify themes and patterns that emerge across the data.

In simplified terms, qualitative research methods involve non-numerical data collection followed by an explanation based on the attributes of the data . For example, if you are asked to explain in qualitative terms a thermal image displayed in multiple colors, then you would explain the color differences rather than the heat's numerical value. If you have a large amount of data (e.g., of group discussions or observations of real-life situations), the next step is to transcribe and prepare the raw data for subsequent analysis.
Researchers can conduct studies fully based on qualitative methodology, or researchers can preface a quantitative research study with a qualitative study to identify issues that were not originally envisioned but are important to the study. Quantitative researchers may also collect and analyze qualitative data following their quantitative analyses to better understand the meanings behind their statistical results.
Conducting qualitative research can especially help build an understanding of how and why certain outcomes were achieved (in addition to what was achieved). For example, qualitative data analysis is often used for policy and program evaluation research since it can answer certain important questions more efficiently and effectively than quantitative approaches.

Qualitative data analysis can also answer important questions about the relevance, unintended effects, and impact of programs, such as:
- Were expectations reasonable?
- Did processes operate as expected?
- Were key players able to carry out their duties?
- Were there any unintended effects of the program?
The importance of qualitative data analysis
Qualitative approaches have the advantage of allowing for more diversity in responses and the capacity to adapt to new developments or issues during the research process itself. While qualitative data analysis can be demanding and time-consuming to conduct, many fields of research utilize qualitative software tools that have been specifically developed to provide more succinct, cost-efficient, and timely results.
Qualitative data analysis is an important part of research and building greater understanding across fields for a number of reasons. First, cases for qualitative data analysis can be selected purposefully according to whether they typify certain characteristics or contextual locations. In other words, qualitative data permits deep immersion into a topic, phenomenon, or area of interest. Rather than seeking generalizability to the population the sample of participants represent, qualitative research aims to construct an in-depth and nuanced understanding of the research topic.
Secondly, the role or position of the researcher in qualitative data analysis is given greater critical attention. This is because, in qualitative data analysis, the possibility of the researcher taking a ‘neutral' or transcendent position is seen as more problematic in practical and/or philosophical terms. Hence, qualitative researchers are often exhorted to reflect on their role in the research process and make this clear in the analysis.

Thirdly, while qualitative data analysis can take a wide variety of forms, it largely differs from quantitative research in the focus on language, signs, experiences, and meaning. In addition, qualitative approaches to analysis are often holistic and contextual rather than analyzing the data in a piecemeal fashion or removing the data from its context. Qualitative approaches thus allow researchers to explore inquiries from directions that could not be accessed with only numerical quantitative data.
Establishing research rigor
Systematic and transparent approaches to the analysis of qualitative data are essential for rigor . For example, many qualitative research methods require researchers to carefully code data and discern and document themes in a consistent and credible way.
Perhaps the most traditional division in the way qualitative and quantitative research have been used in the social sciences is for qualitative methods to be used for exploratory purposes (e.g., to generate new theory or propositions) or to explain puzzling quantitative results, while quantitative methods are used to test hypotheses .

After you’ve collected relevant data , what is the best way to look at your data ? As always, it will depend on your research question . For instance, if you employed an observational research method to learn about a group’s shared practices, an ethnographic approach could be appropriate to explain the various dimensions of culture. If you collected textual data to understand how people talk about something, then a discourse analysis approach might help you generate key insights about language and communication.

The qualitative data coding process involves iterative categorization and recategorization, ensuring the evolution of the analysis to best represent the data. The procedure typically concludes with the interpretation of patterns and trends identified through the coding process.
To start off, let’s look at two broad approaches to data analysis.
Deductive analysis
Deductive analysis is guided by pre-existing theories or ideas. It starts with a theoretical framework , which is then used to code the data. The researcher can thus use this theoretical framework to interpret their data and answer their research question .
The key steps include coding the data based on the predetermined concepts or categories and using the theory to guide the interpretation of patterns among the codings. Deductive analysis is particularly useful when researchers aim to verify or extend an existing theory within a new context.
Inductive analysis
Inductive analysis involves the generation of new theories or ideas based on the data. The process starts without any preconceived theories or codes, and patterns, themes, and categories emerge out of the data.

The researcher codes the data to capture any concepts or patterns that seem interesting or important to the research question . These codes are then compared and linked, leading to the formation of broader categories or themes. The main goal of inductive analysis is to allow the data to 'speak for itself' rather than imposing pre-existing expectations or ideas onto the data.
Deductive and inductive approaches can be seen as sitting on opposite poles, and all research falls somewhere within that spectrum. Most often, qualitative data analysis approaches blend both deductive and inductive elements to contribute to the existing conversation around a topic while remaining open to potential unexpected findings. To help you make informed decisions about which qualitative data analysis approach fits with your research objectives, let's look at some of the common approaches for qualitative data analysis.
Content analysis is a research method used to identify patterns and themes within qualitative data. This approach involves systematically coding and categorizing specific aspects of the content in the data to uncover trends and patterns. An often important part of content analysis is quantifying frequencies and patterns of words or characteristics present in the data .
It is a highly flexible technique that can be adapted to various data types , including text, images, and audiovisual content . While content analysis can be exploratory in nature, it is also common to use pre-established theories and follow a more deductive approach to categorizing and quantifying the qualitative data.
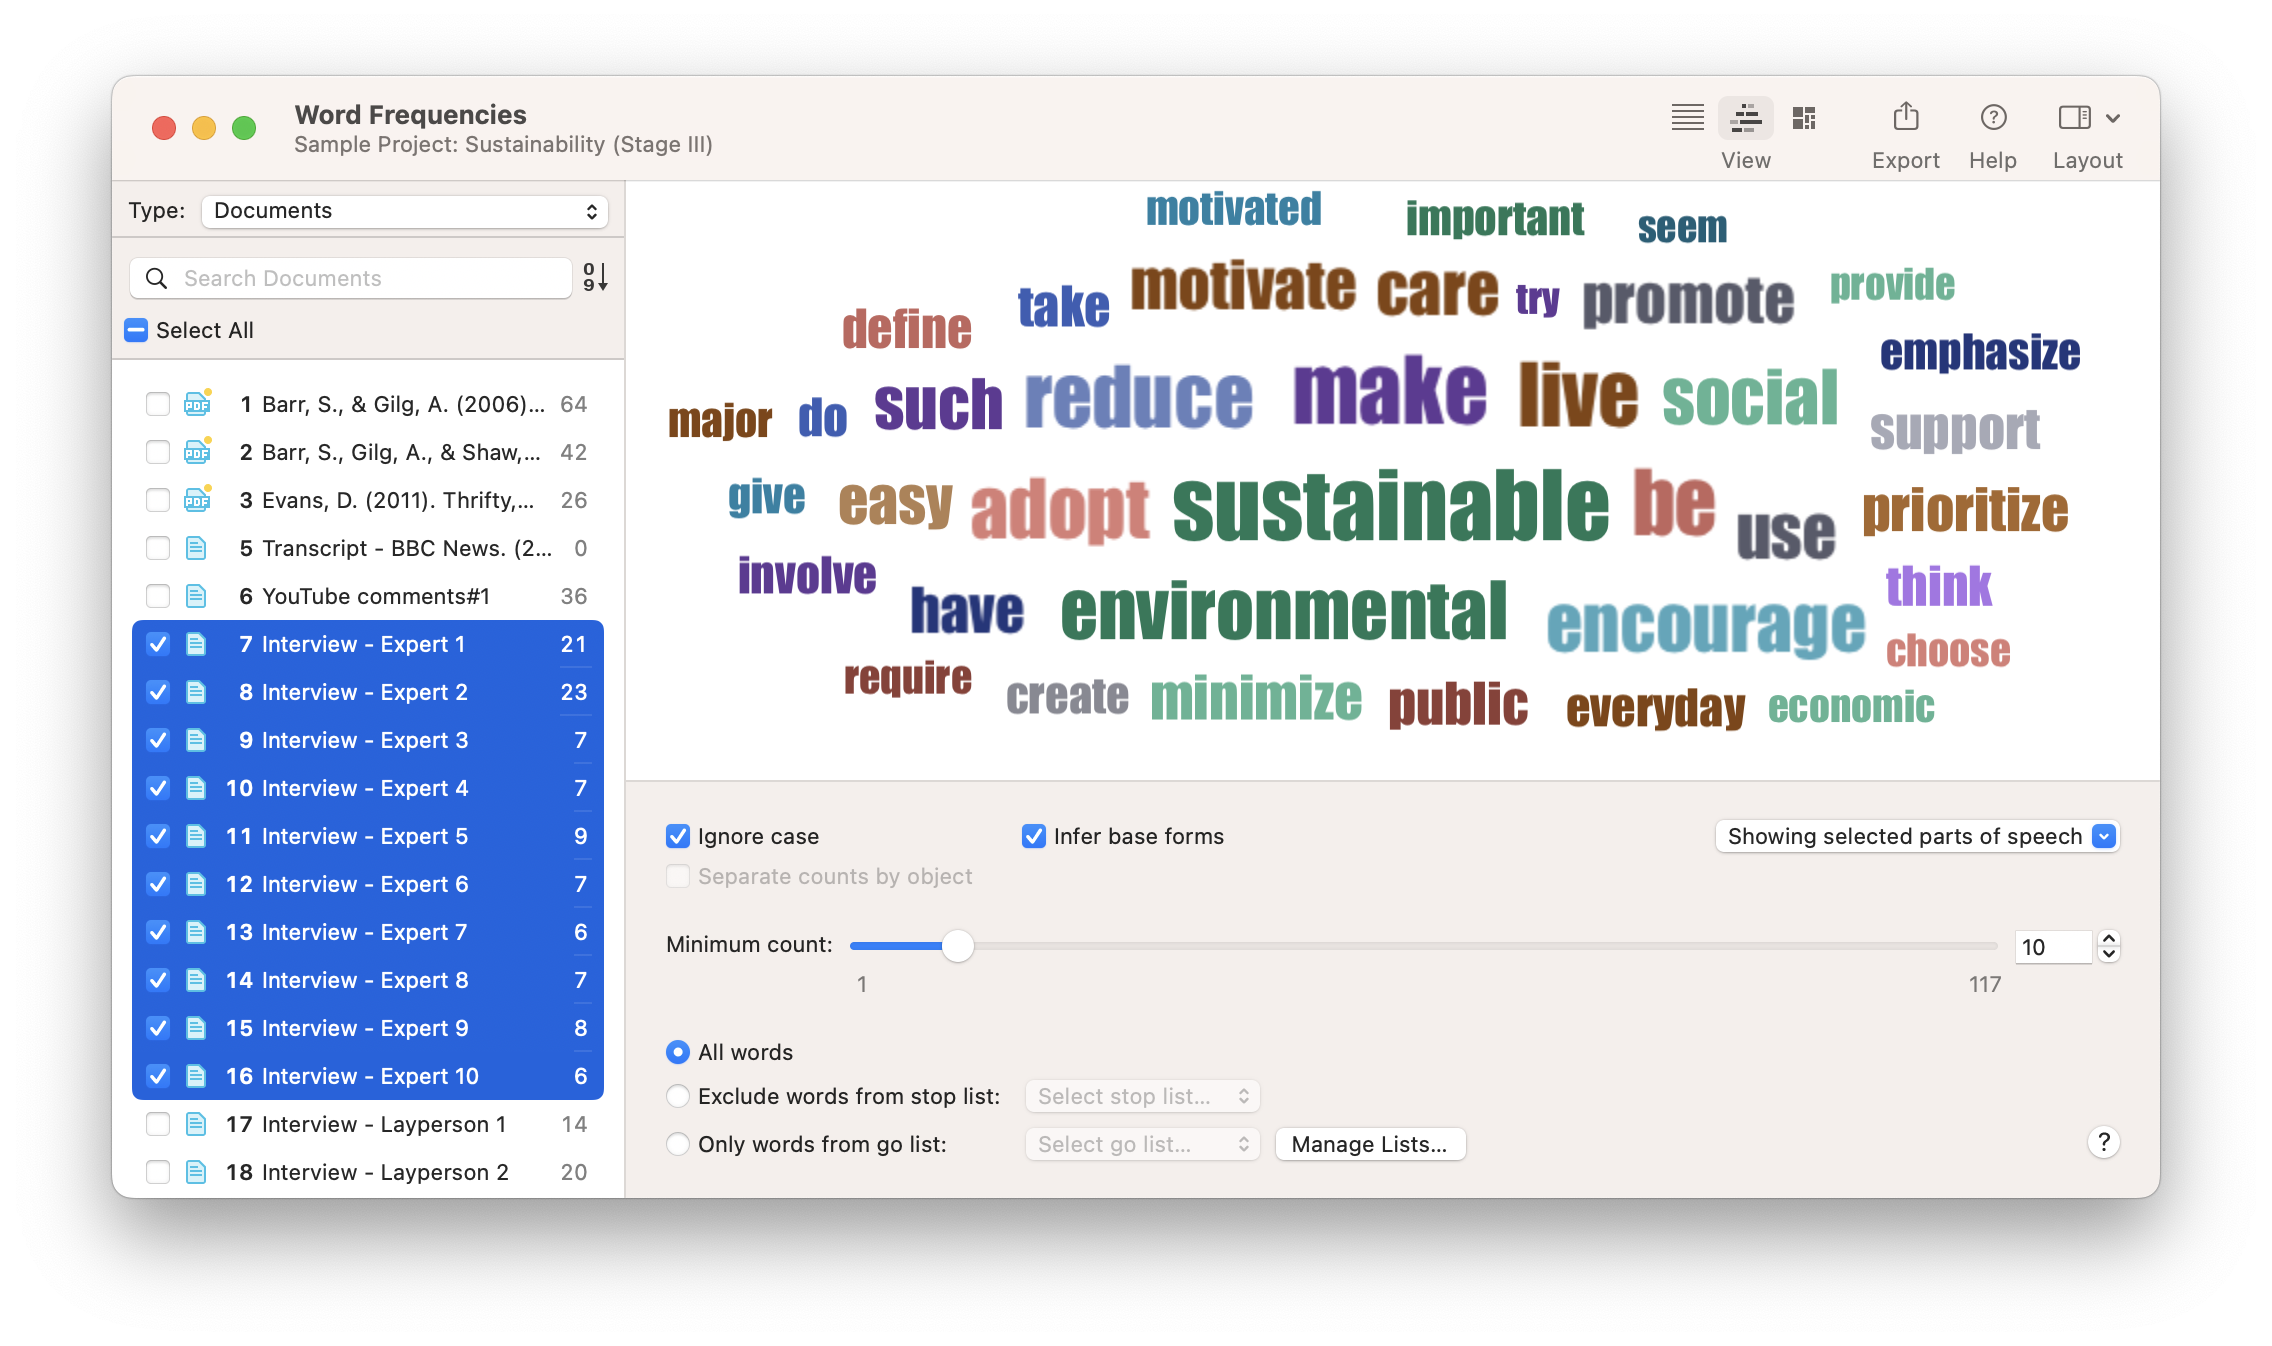
Thematic analysis is a method used to identify, analyze, and report patterns or themes within the data. This approach moves beyond counting explicit words or phrases and focuses on also identifying implicit concepts and themes within the data.

Researchers conduct detailed coding of the data to ascertain repeated themes or patterns of meaning. Codes can be categorized into themes, and the researcher can analyze how the themes relate to one another. Thematic analysis is flexible in terms of the research framework, allowing for both inductive (data-driven) and deductive (theory-driven) approaches. The outcome is a rich, detailed, and complex account of the data.
Grounded theory is a systematic qualitative research methodology that is used to inductively generate theory that is 'grounded' in the data itself. Analysis takes place simultaneously with data collection , and researchers iterate between data collection and analysis until a comprehensive theory is developed.
Grounded theory is characterized by simultaneous data collection and analysis, the development of theoretical codes from the data, purposeful sampling of participants, and the constant comparison of data with emerging categories and concepts. The ultimate goal is to create a theoretical explanation that fits the data and answers the research question .
Discourse analysis is a qualitative research approach that emphasizes the role of language in social contexts. It involves examining communication and language use beyond the level of the sentence, considering larger units of language such as texts or conversations.

Discourse analysts typically investigate how social meanings and understandings are constructed in different contexts, emphasizing the connection between language and power. It can be applied to texts of all kinds, including interviews , documents, case studies , and social media posts.
Phenomenological research focuses on exploring how human beings make sense of an experience and examines the essence of this experience. It strives to understand people's perceptions, perspectives, and understandings of a particular situation or phenomenon.

It involves in-depth engagement with participants, often through interviews or conversations, to explore their lived experiences. The goal is to derive detailed descriptions of the essence of the experience and to interpret what insights or implications this may bear on our understanding of this phenomenon.

Whatever your data analysis approach, start with ATLAS.ti
Qualitative data analysis done quickly and intuitively with ATLAS.ti. Download a free trial today.
Now that we've summarized the major approaches to data analysis, let's look at the broader process of research and data analysis. Suppose you need to do some research to find answers to any kind of research question, be it an academic inquiry, business problem, or policy decision. In that case, you need to collect some data. There are many methods of collecting data: you can collect primary data yourself by conducting interviews, focus groups , or a survey , for instance. Another option is to use secondary data sources. These are data previously collected for other projects, historical records, reports, statistics – basically everything that exists already and can be relevant to your research.

The data you collect should always be a good fit for your research question . For example, if you are interested in how many people in your target population like your brand compared to others, it is no use to conduct interviews or a few focus groups . The sample will be too small to get a representative picture of the population. If your questions are about "how many….", "what is the spread…" etc., you need to conduct quantitative research . If you are interested in why people like different brands, their motives, and their experiences, then conducting qualitative research can provide you with the answers you are looking for.
Let's describe the important steps involved in conducting research.
Step 1: Planning the research
As the saying goes: "Garbage in, garbage out." Suppose you find out after you have collected data that
- you talked to the wrong people
- asked the wrong questions
- a couple of focus groups sessions would have yielded better results because of the group interaction, or
- a survey including a few open-ended questions sent to a larger group of people would have been sufficient and required less effort.
Think thoroughly about sampling, the questions you will be asking, and in which form. If you conduct a focus group or an interview, you are the research instrument, and your data collection will only be as good as you are. If you have never done it before, seek some training and practice. If you have other people do it, make sure they have the skills.
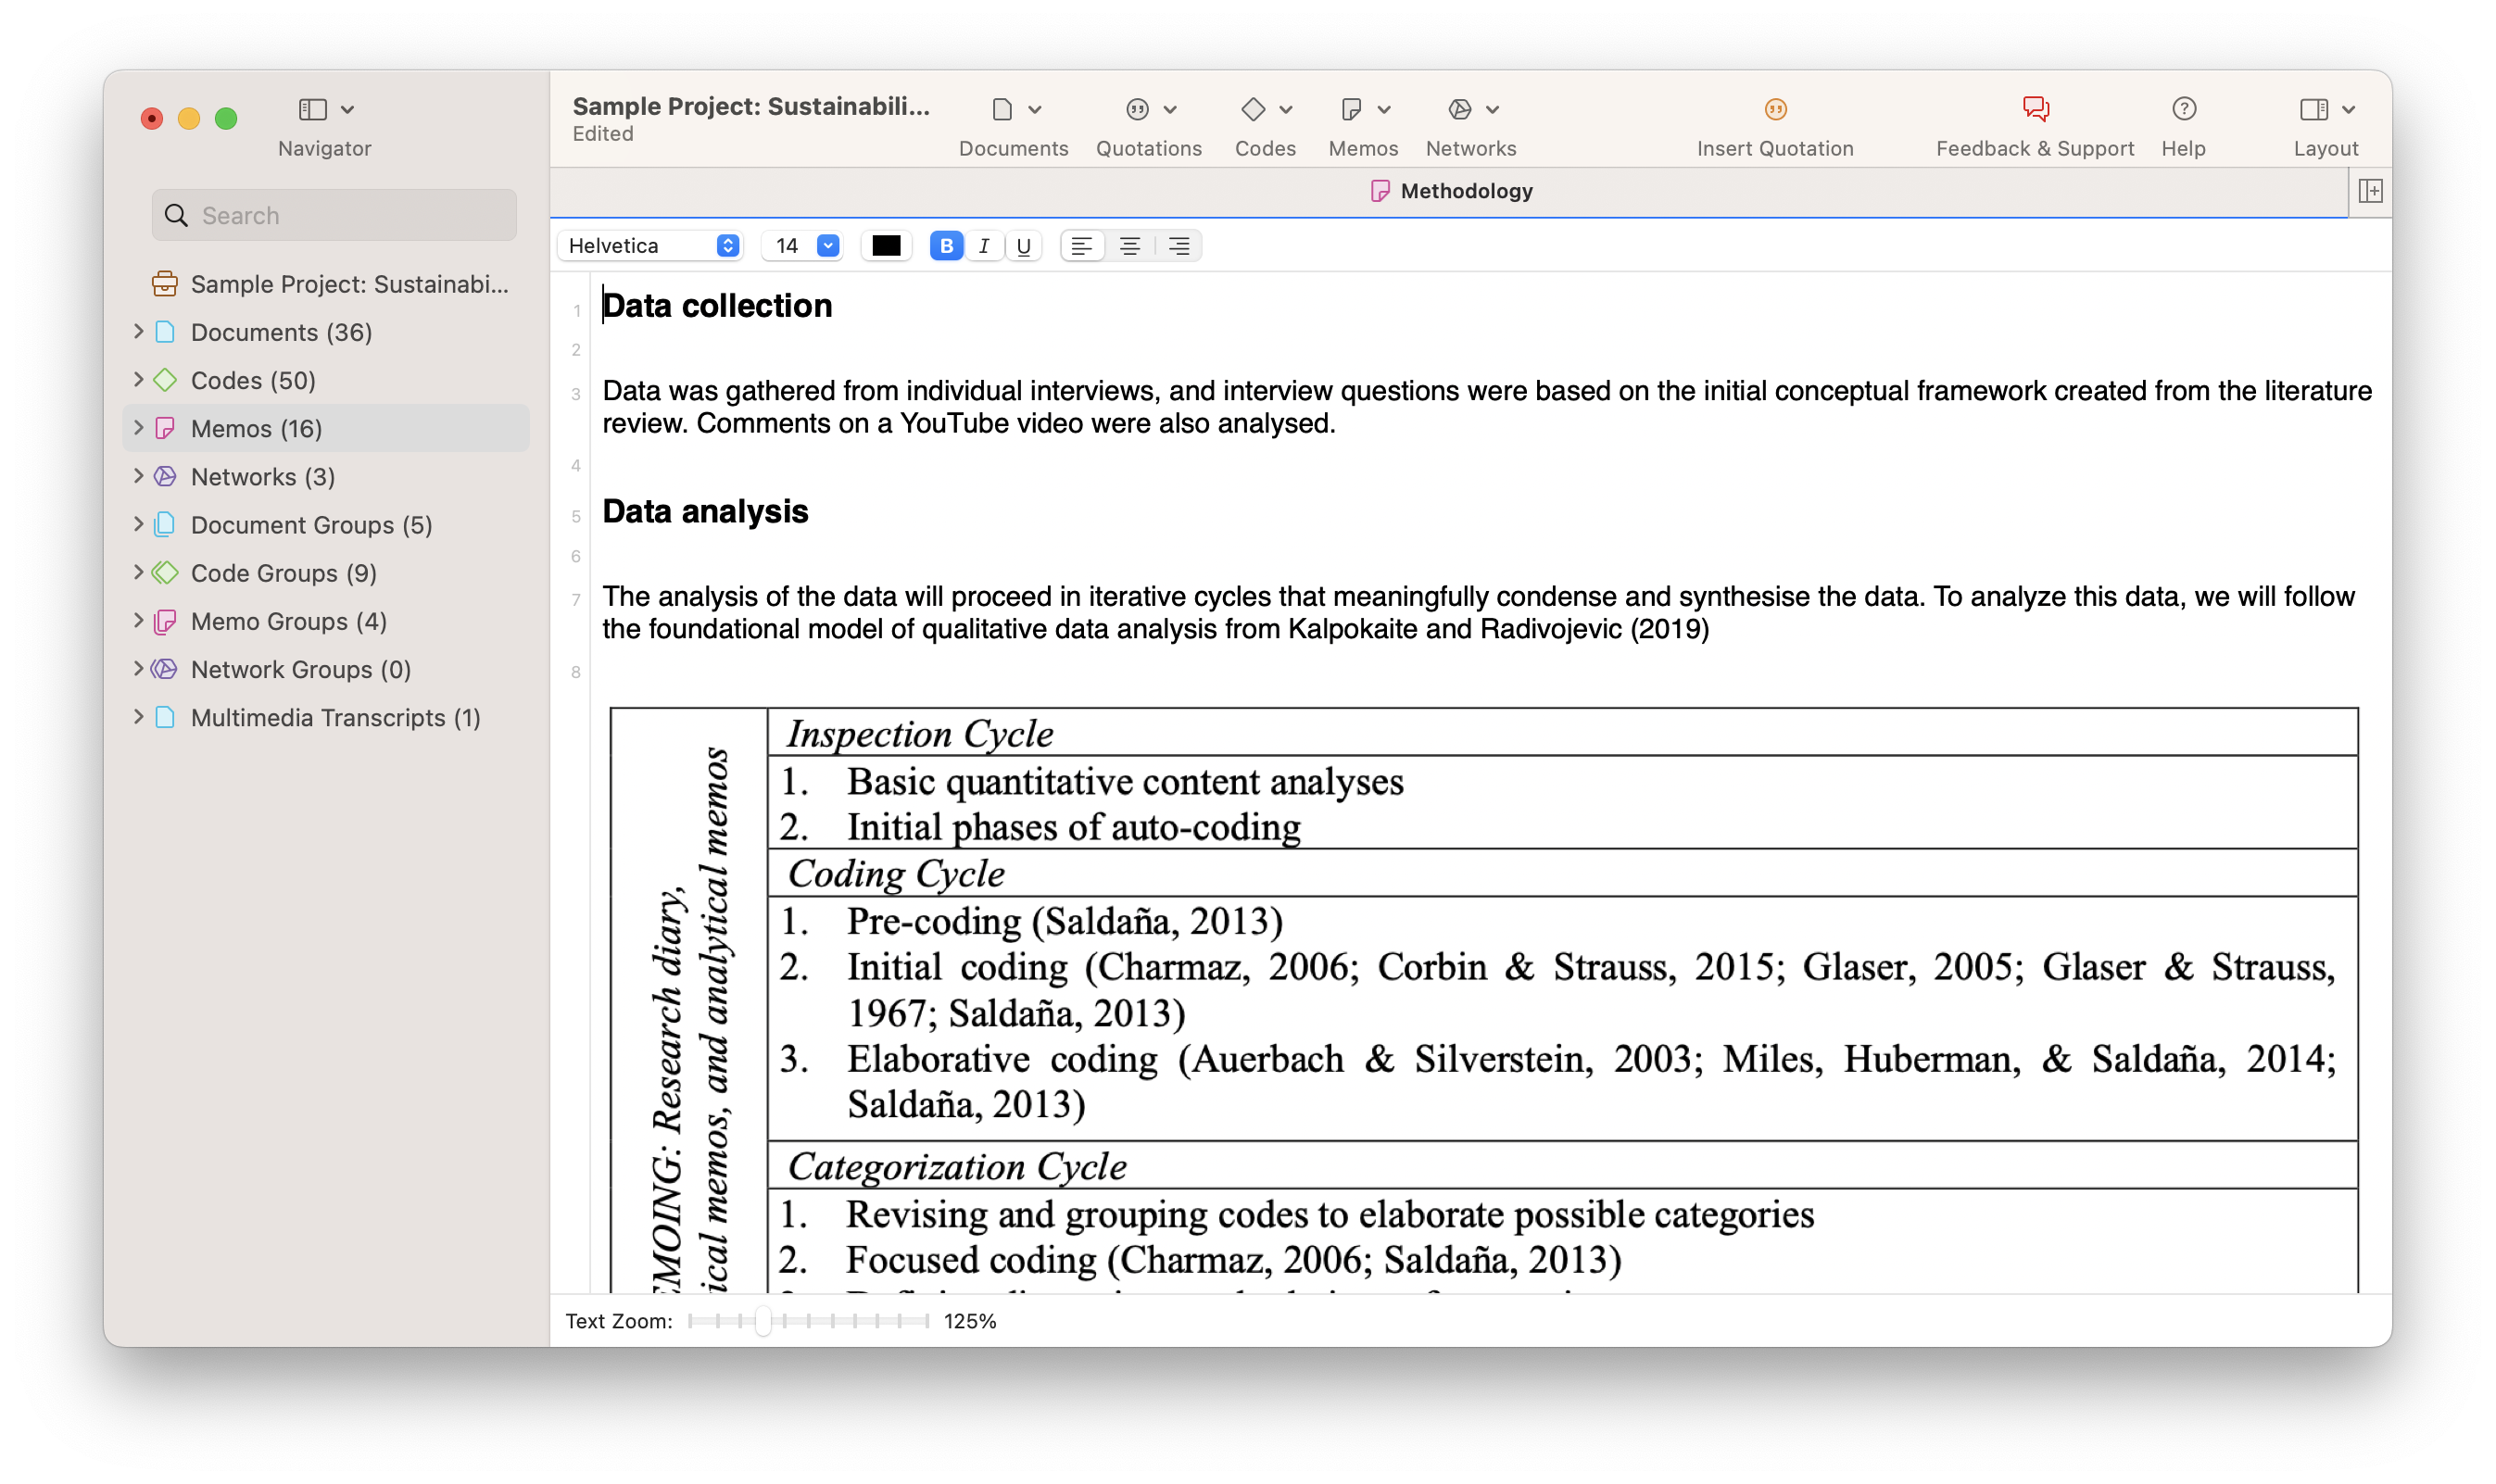
Step 2: Preparing the data
When you conduct focus groups or interviews, think about how to transcribe them. Do you want to run them online or offline? If online, check out which tools can serve your needs, both in terms of functionality and cost. For any audio or video recordings , you can consider using automatic transcription software or services. Automatically generated transcripts can save you time and money, but they still need to be checked. If you don't do this yourself, make sure that you instruct the person doing it on how to prepare the data.
- How should the final transcript be formatted for later analysis?
- Which names and locations should be anonymized?
- What kind of speaker IDs to use?
What about survey data ? Some survey data programs will immediately provide basic descriptive-level analysis of the responses. ATLAS.ti will support you with the analysis of the open-ended questions. For this, you need to export your data as an Excel file. ATLAS.ti's survey import wizard will guide you through the process.
Other kinds of data such as images, videos, audio recordings, text, and more can be imported to ATLAS.ti. You can organize all your data into groups and write comments on each source of data to maintain a systematic organization and documentation of your data.

Step 3: Exploratory data analysis
You can run a few simple exploratory analyses to get to know your data. For instance, you can create a word list or word cloud of all your text data or compare and contrast the words in different documents. You can also let ATLAS.ti find relevant concepts for you. There are many tools available that can automatically code your text data, so you can also use these codings to explore your data and refine your coding.
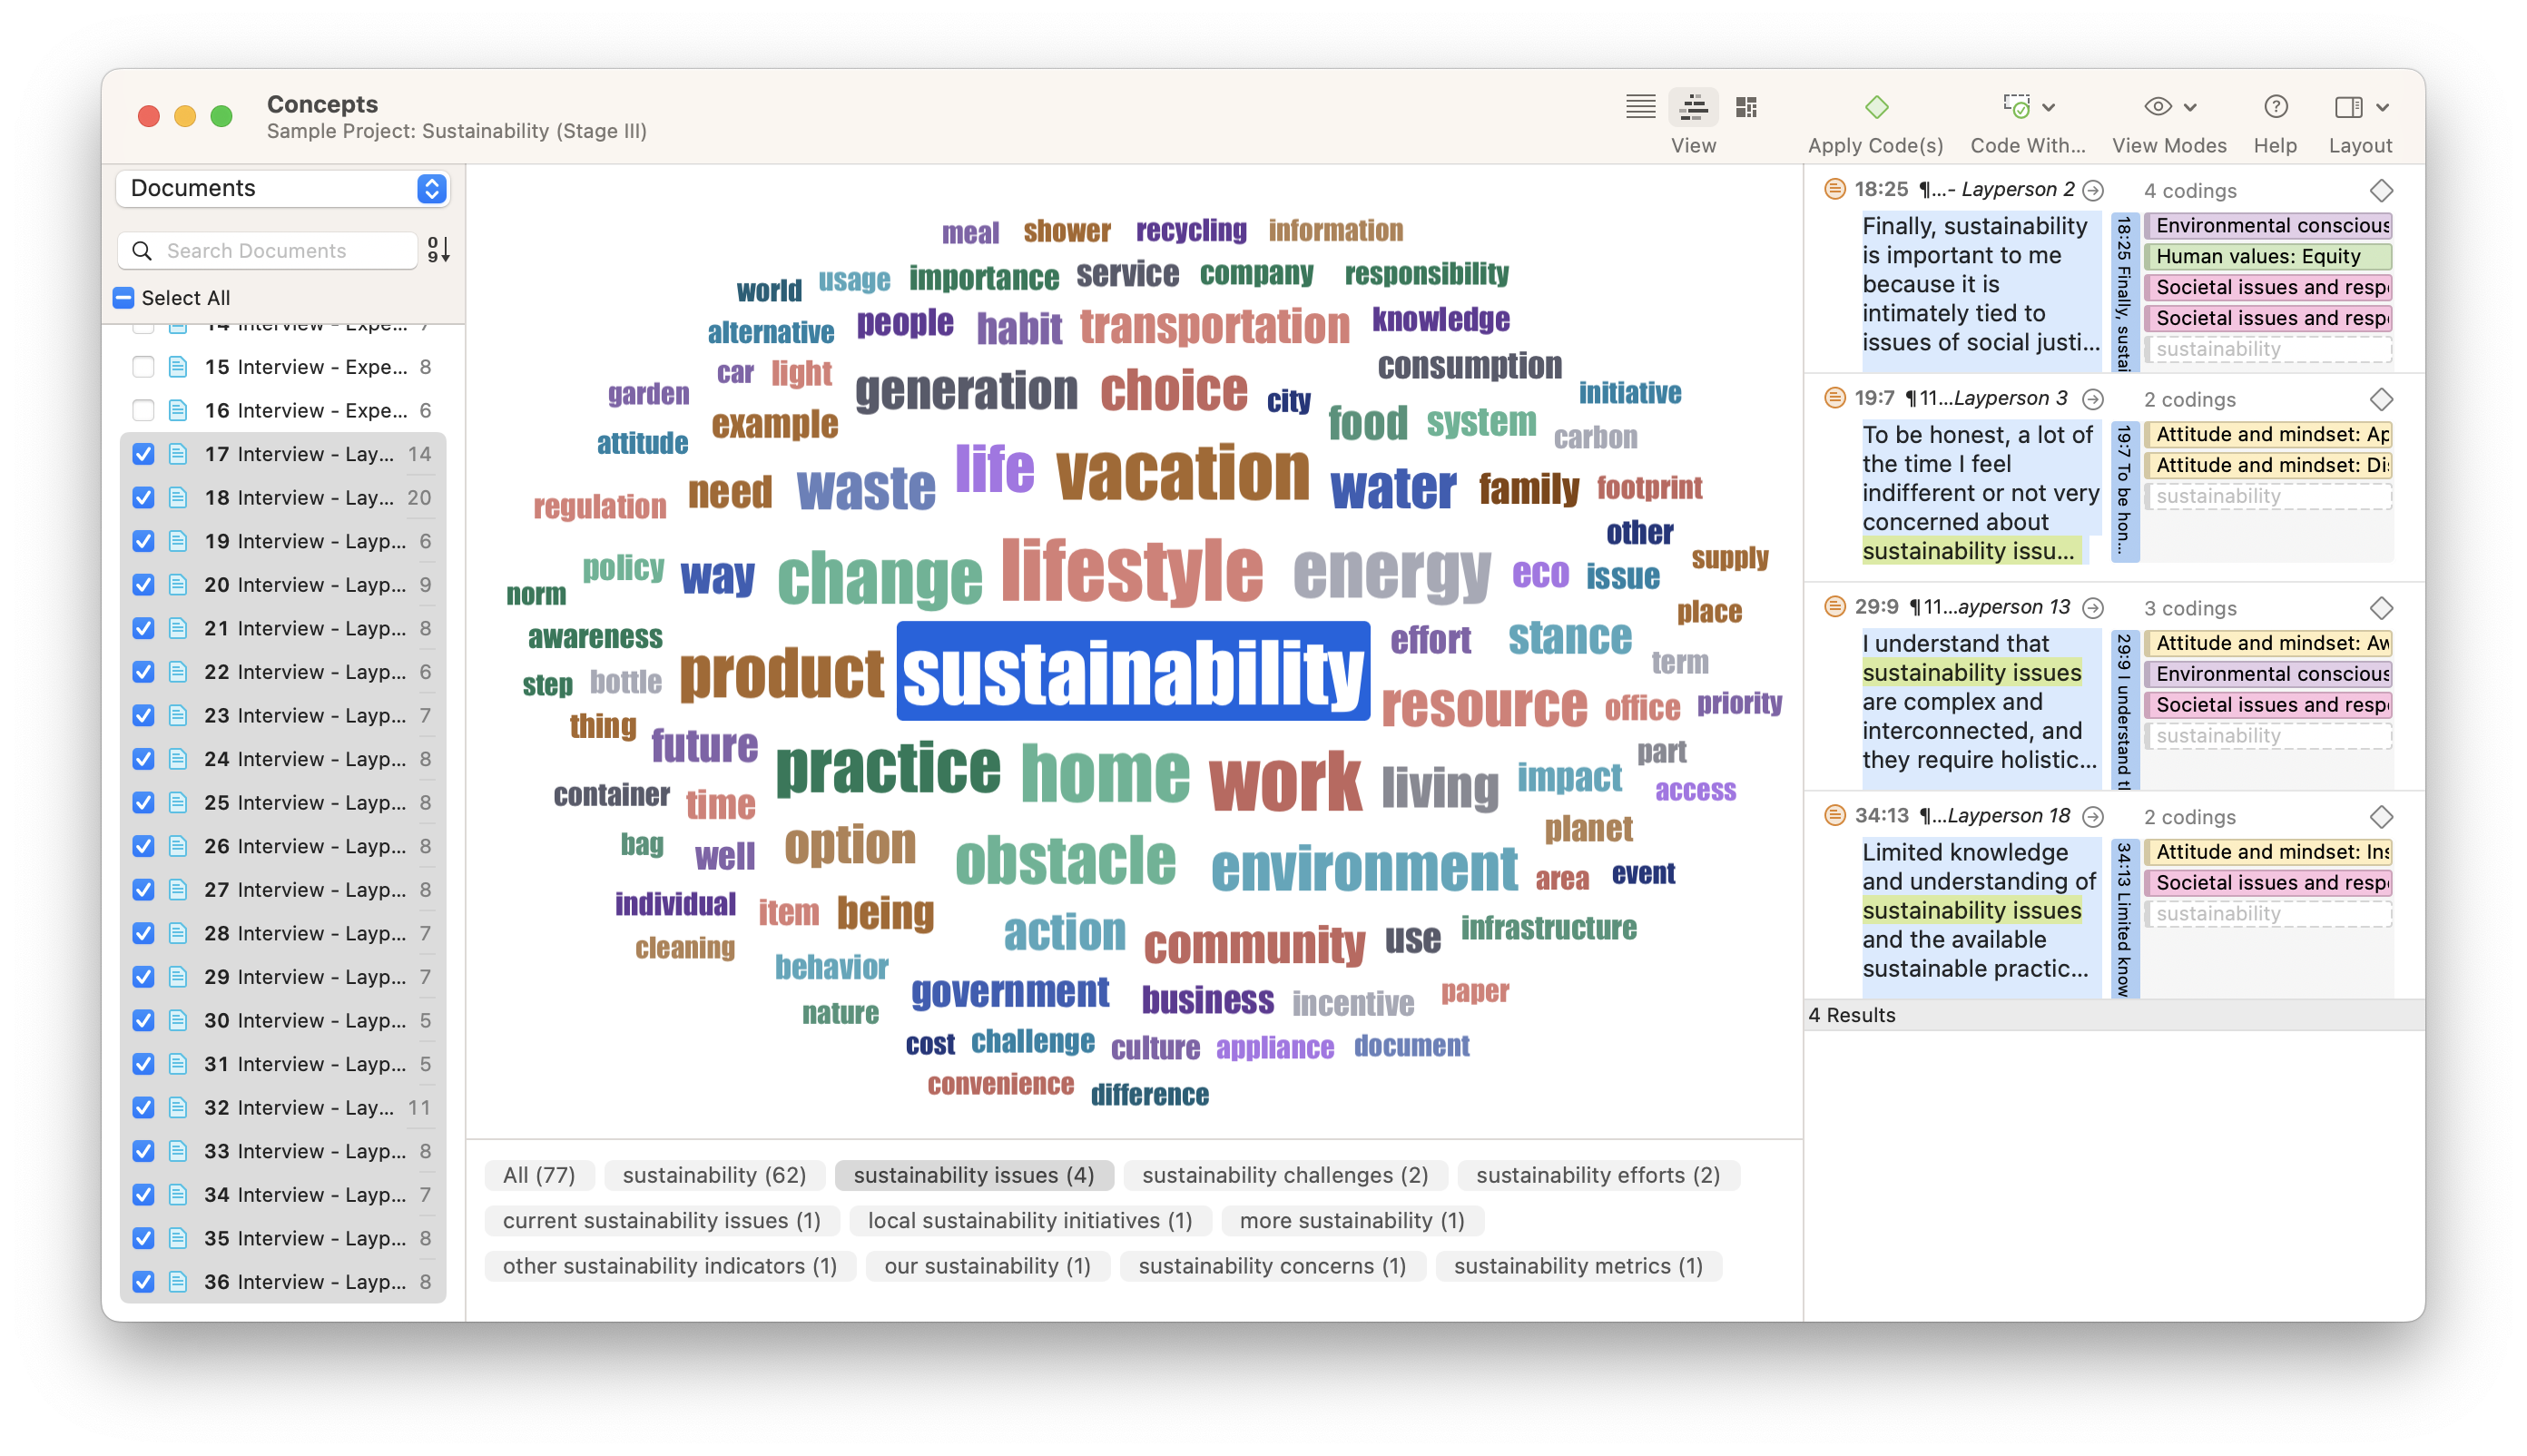
For instance, you can get a feeling for the sentiments expressed in the data. Who is more optimistic, pessimistic, or neutral in their responses? ATLAS.ti can auto-code the positive, negative, and neutral sentiments in your data. Naturally, you can also simply browse through your data and highlight relevant segments that catch your attention or attach codes to begin condensing the data.
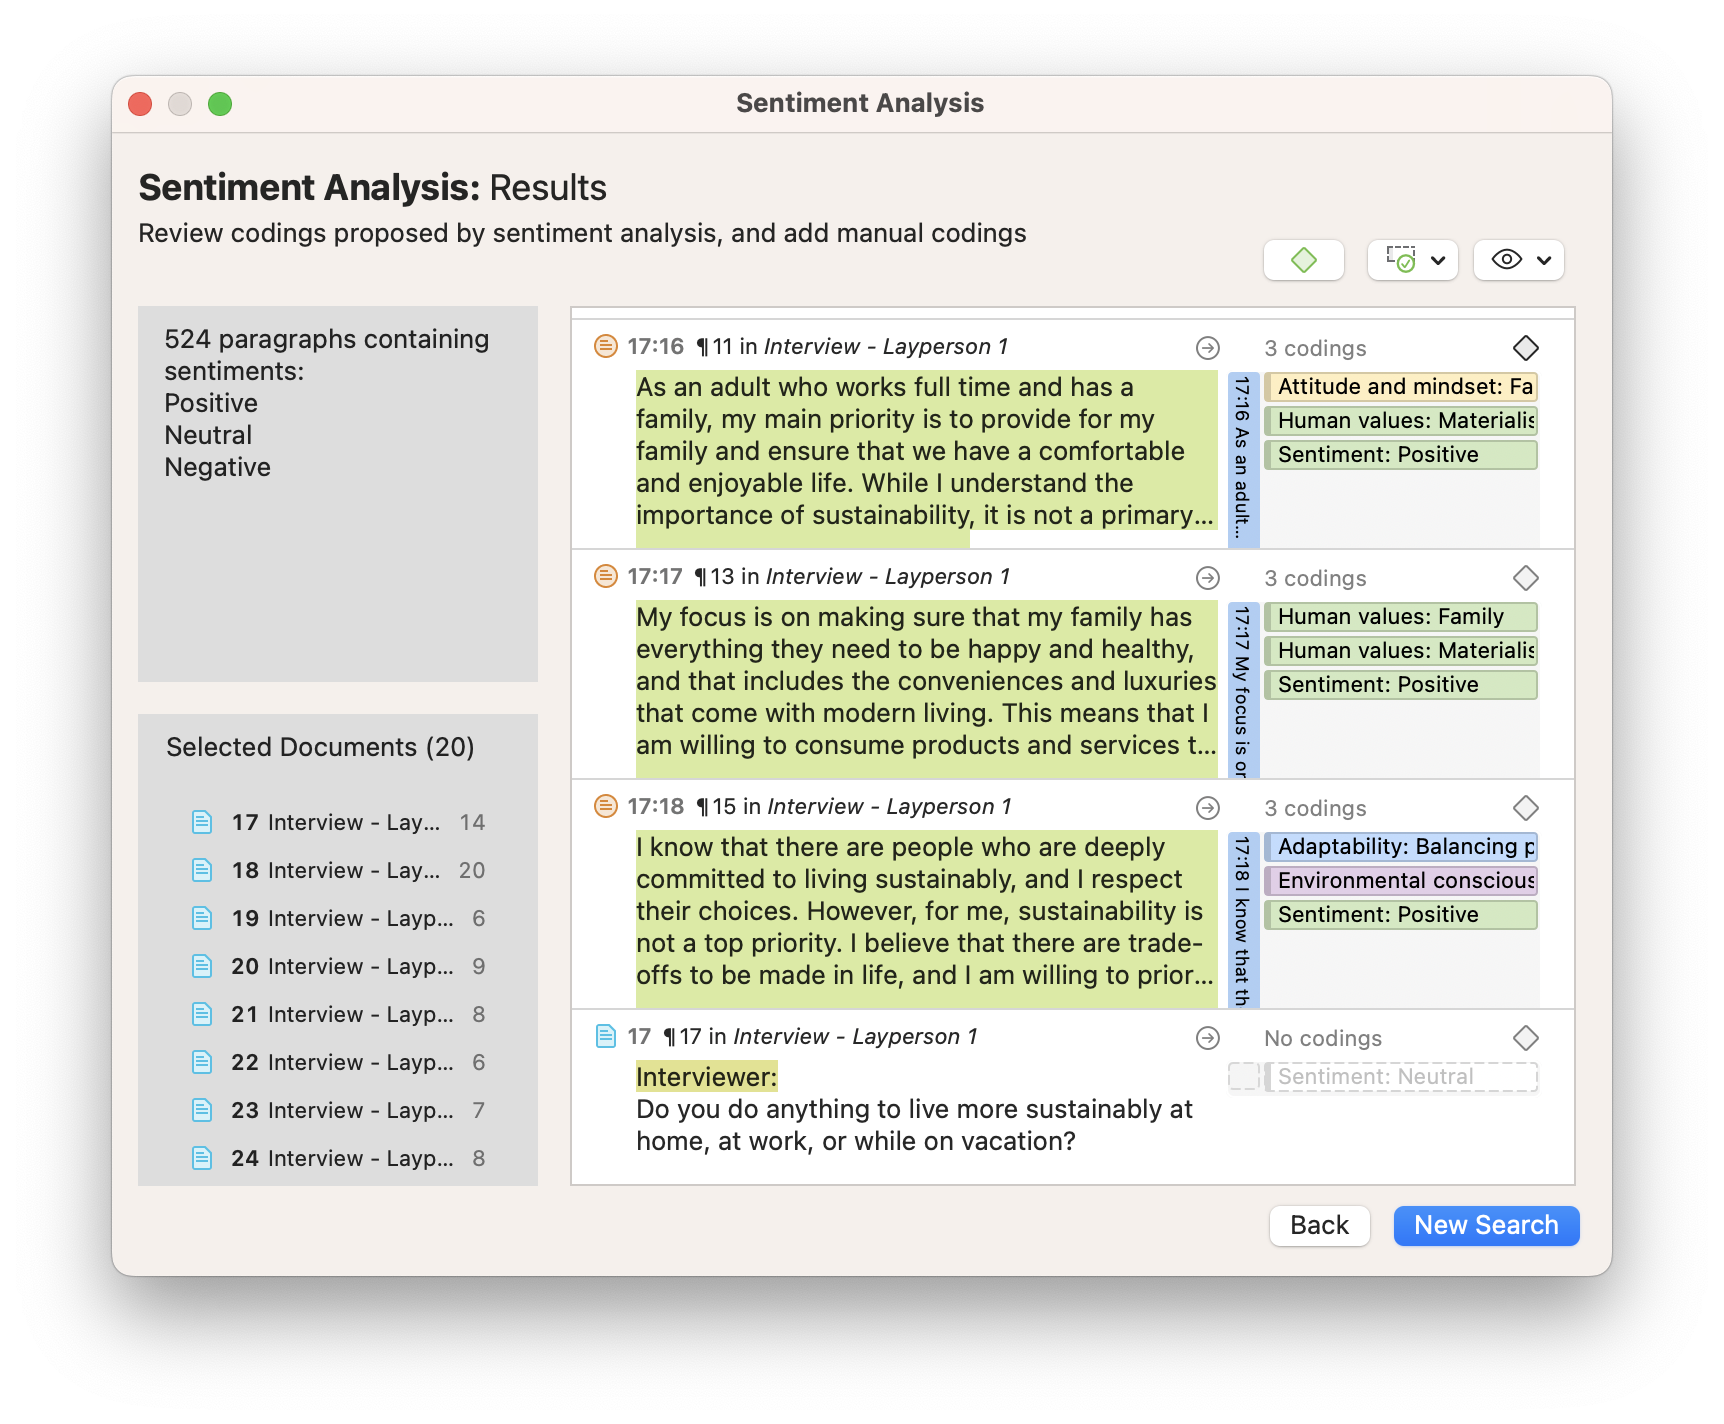
Step 4: Build a code system
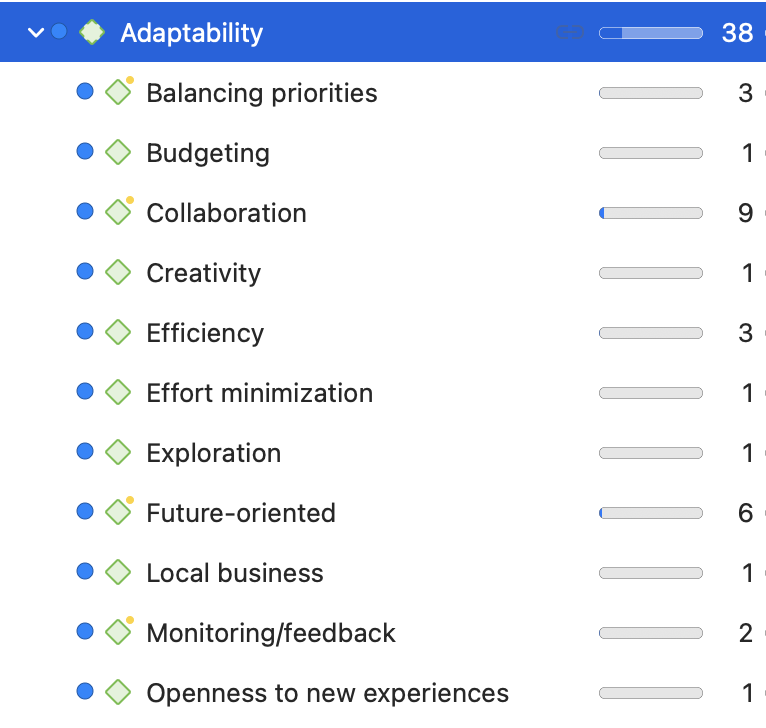
Whether you start with auto-coding or manual coding, after having generated some first codes, you need to get some order in your code system to develop a cohesive understanding. You can build your code system by sorting codes into groups and creating categories and subcodes. As this process requires reading and re-reading your data, you will become very familiar with your data. Counting on a tool like ATLAS.ti qualitative data analysis software will support you in the process and make it easier to review your data, modify codings if necessary, change code labels, and write operational definitions to explain what each code means.
Step 5: Query your coded data and write up the analysis
Once you have coded your data, it is time to take the analysis a step further. When using software for qualitative data analysis , it is easy to compare and contrast subsets in your data, such as groups of participants or sets of themes.
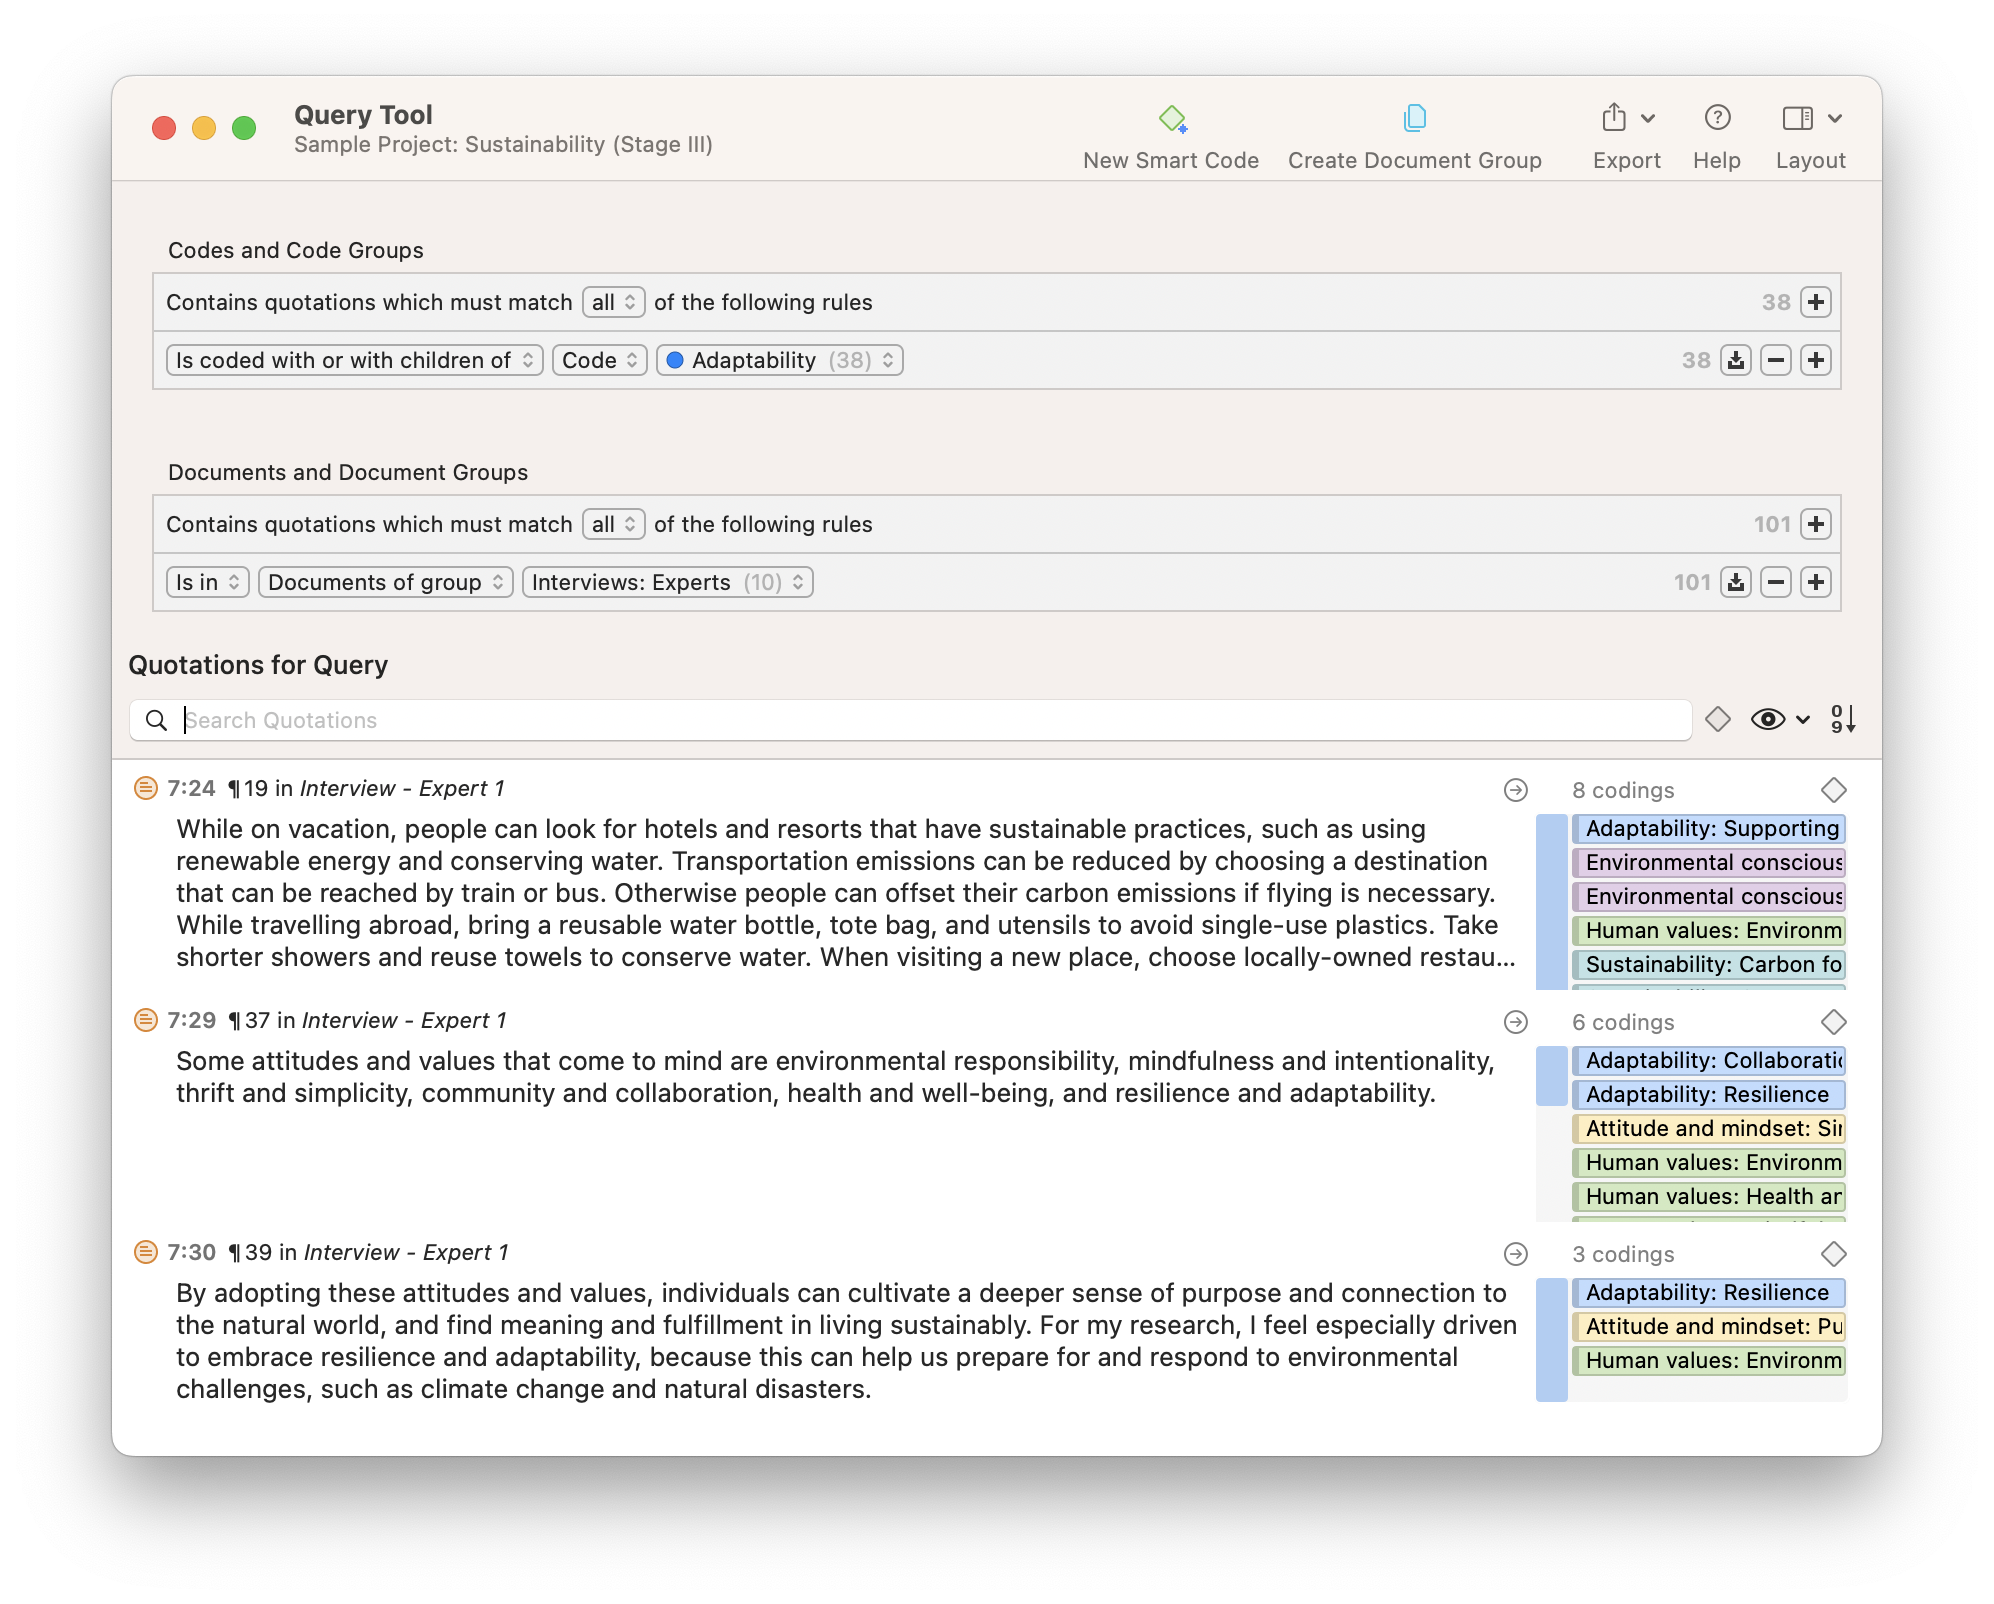
For instance, you can query the various opinions of female vs. male respondents. Is there a difference between consumers from rural or urban areas or among different age groups or educational levels? Which codes occur together throughout the data set? Are there relationships between various concepts, and if so, why?

Step 6: Data visualization
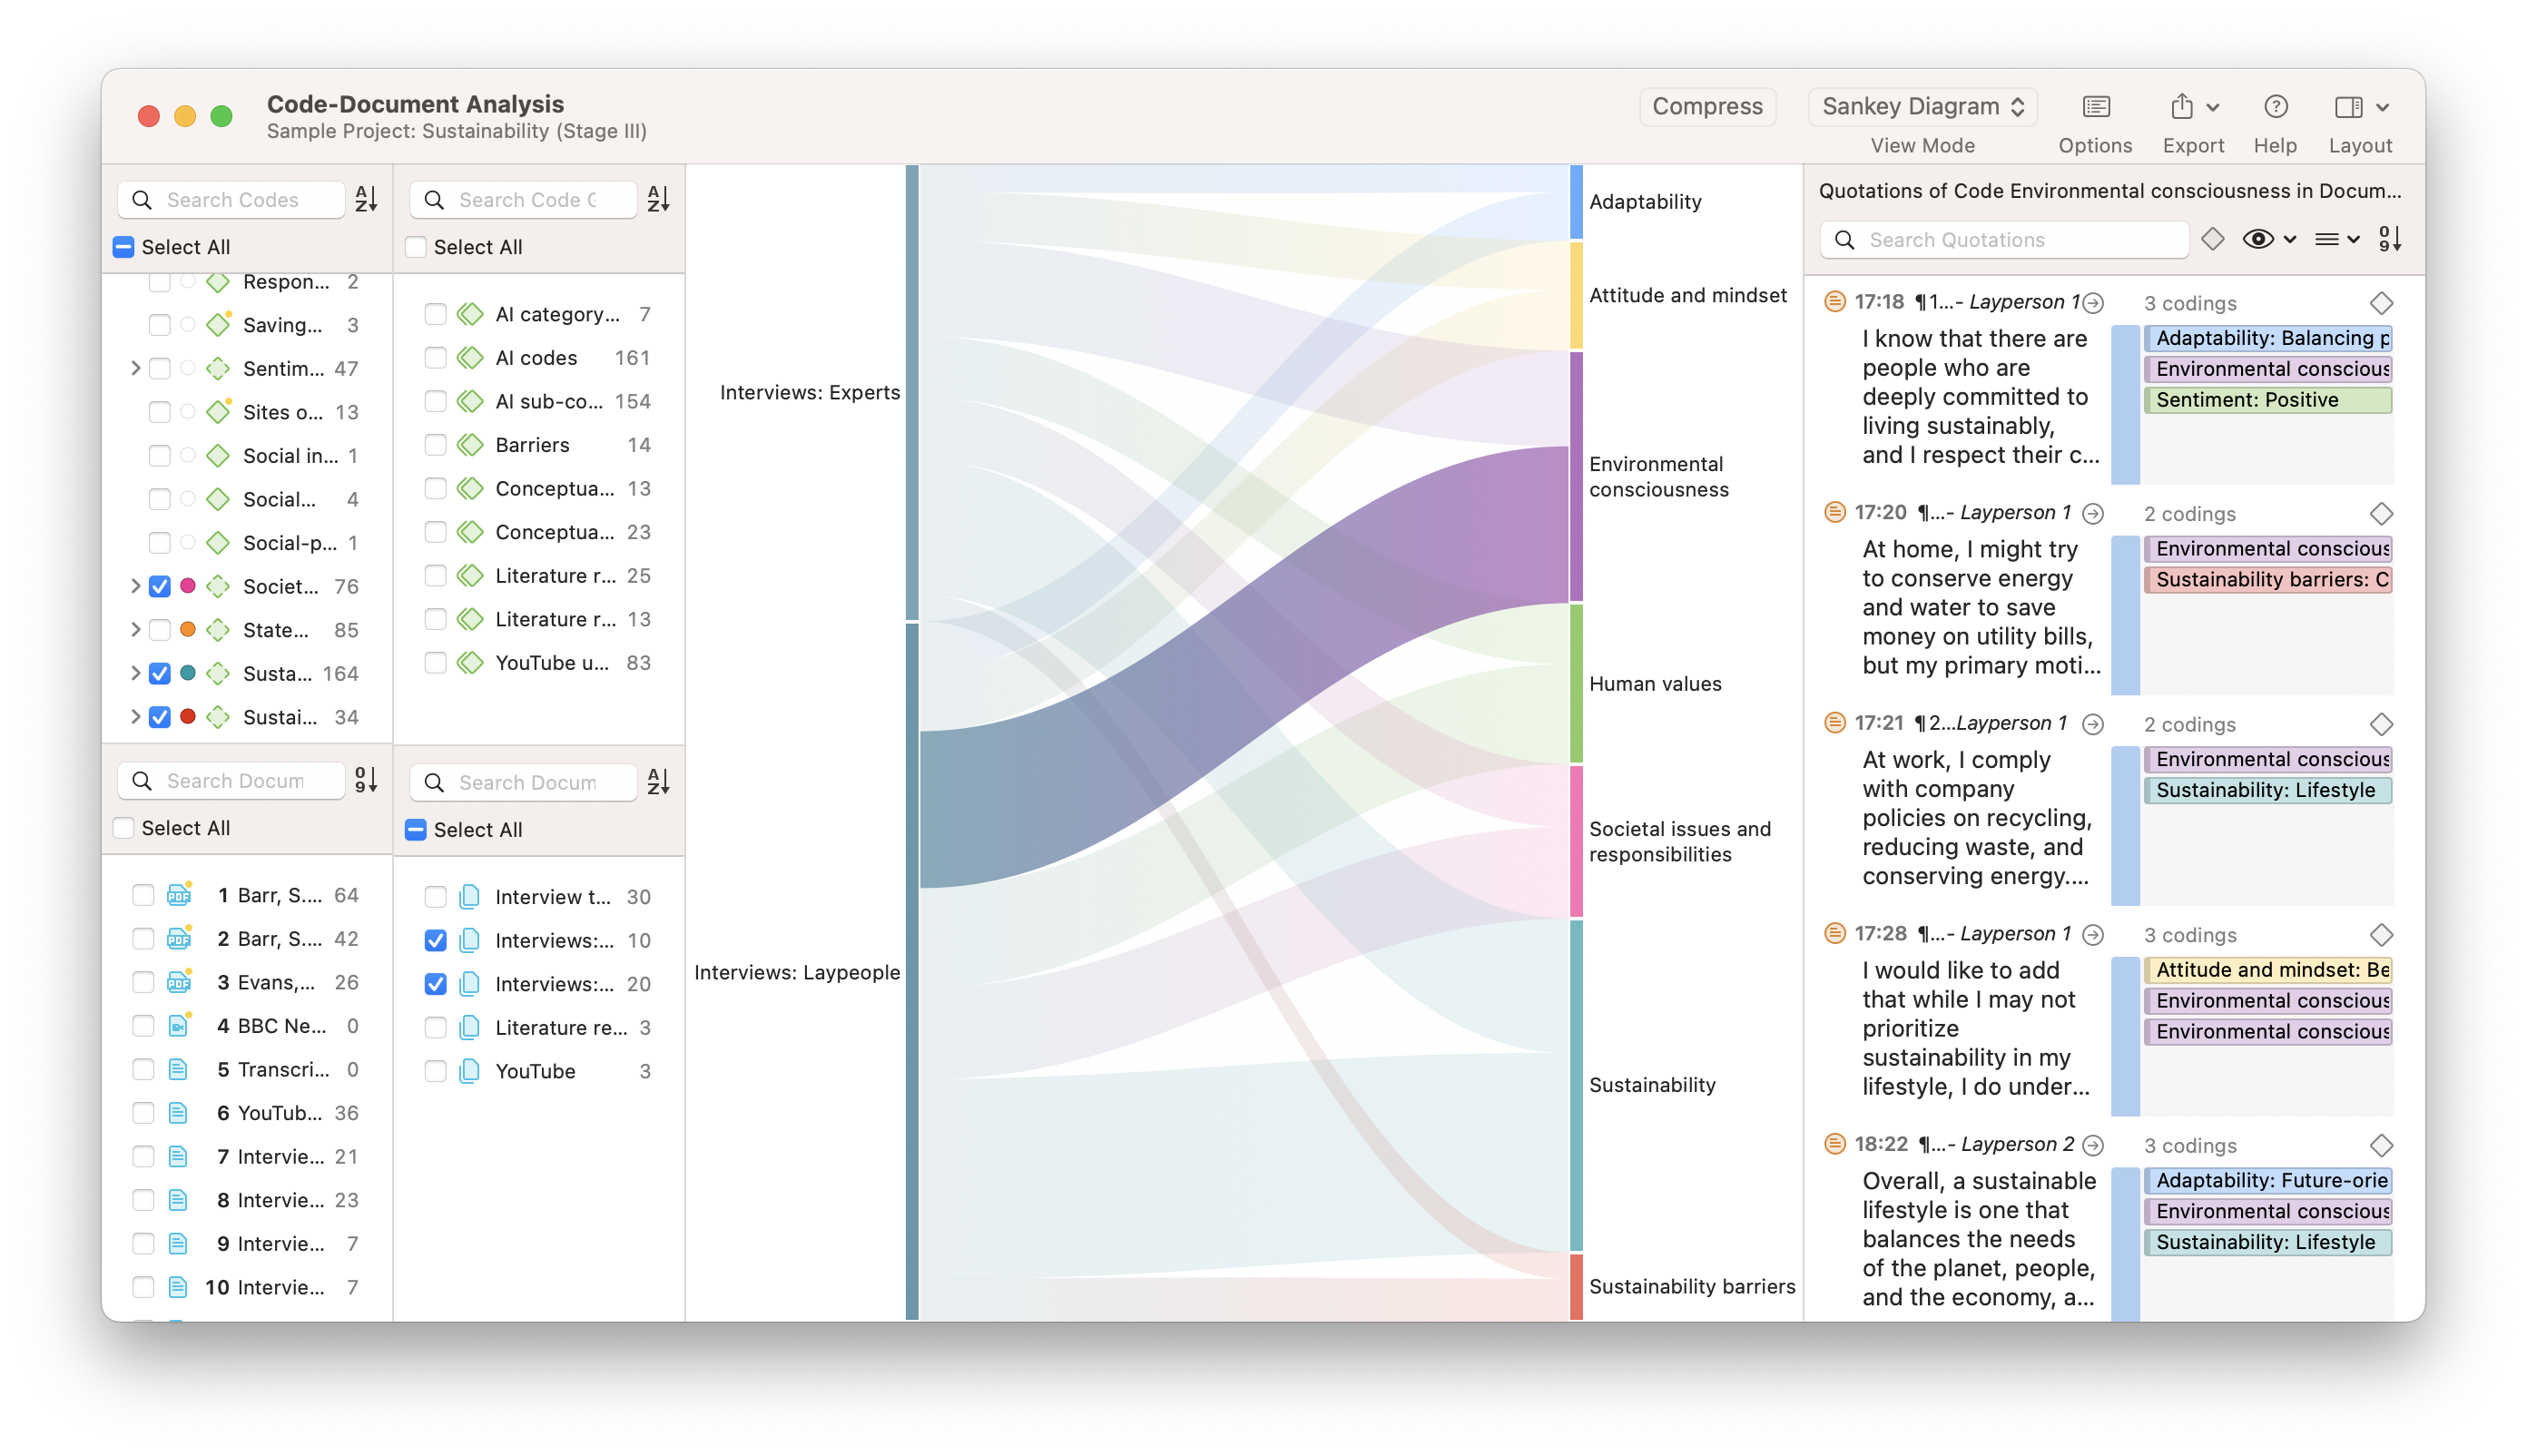
Data visualization brings your data to life. It is a powerful way of seeing patterns and relationships in your data. For instance, diagrams allow you to see how your codes are distributed across documents or specific subpopulations in your data.
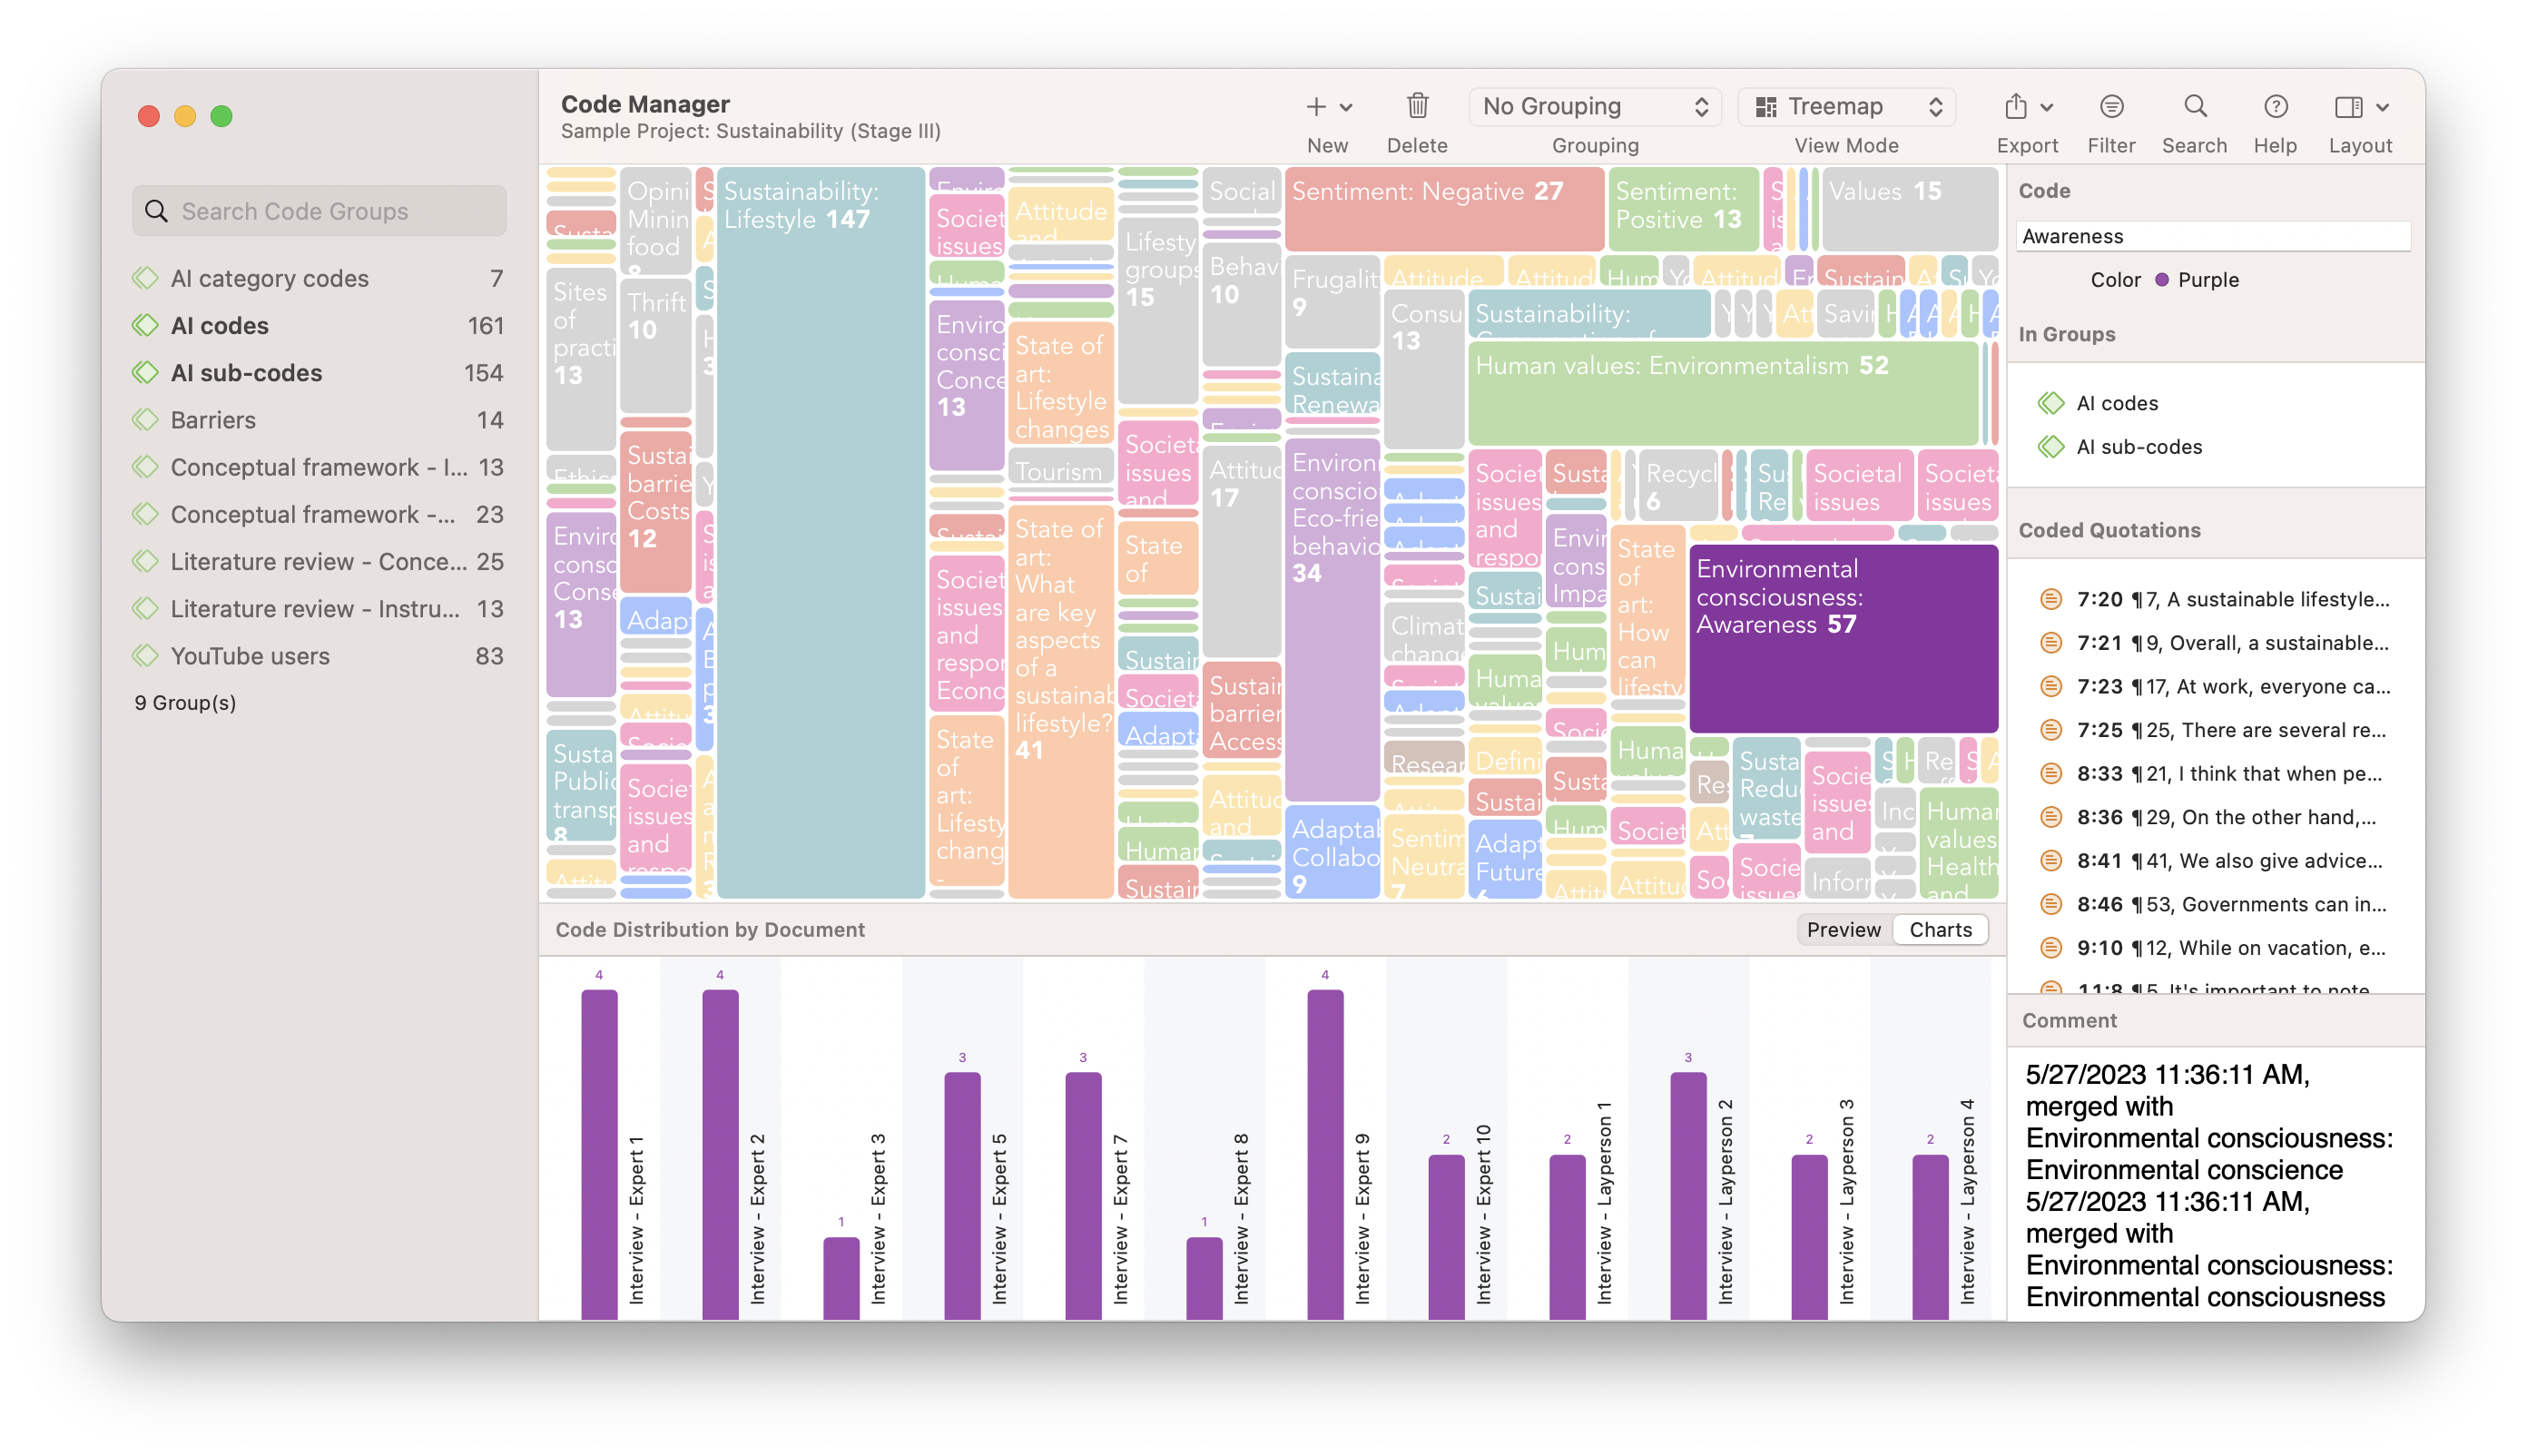
Exploring coded data on a canvas, moving around code labels in a virtual space, linking codes and other elements of your data set, and thinking about how they are related and why – all of these will advance your analysis and spur further insights. Visuals are also great for communicating results to others.
Step 7: Data presentation
The final step is to summarize the analysis in a written report . You can now put together the memos you have written about the various topics, select some salient quotes that illustrate your writing, and add visuals such as tables and diagrams. If you follow the steps above, you will already have all the building blocks, and you just have to put them together in a report or presentation.
When preparing a report or a presentation, keep your audience in mind. Does your audience better understand numbers than long sections of detailed interpretations? If so, add more tables, charts, and short supportive data quotes to your report or presentation. If your audience loves a good interpretation, add your full-length memos and walk your audience through your conceptual networks and illustrative data quotes.
Qualitative data analysis begins with ATLAS.ti
For tools that can make the most out of your data, check out ATLAS.ti with a free trial.
Lean Six Sigma Training Certification
- Facebook Instagram Twitter LinkedIn YouTube
- (877) 497-4462

The Importance of Qualitative Data Analysis in Research: A Comprehensive Guide
August 29th, 2024
Qualitative data analysis, in essence, is the systematic examination of non-numerical information to uncover patterns, themes, and insights.
This process is crucial in various fields, from product development to business process improvement.
Key Highlights
- Defining qualitative data analysis and its importance
- Comparing qualitative and quantitative research methods
- Exploring key approaches: thematic, grounded theory, content analysis
- Understanding the qualitative data analysis process
- Reviewing CAQDAS tools for efficient analysis
- Ensuring rigor through triangulation and member checking
- Addressing challenges and ethical considerations
- Examining future trends in qualitative research
Introduction to Qualitative Data Analysis
Qualitative data analysis is a sophisticated process of examining non-numerical information to extract meaningful insights.
It’s not just about reading through text; it’s about diving deep into the nuances of human experiences, opinions, and behaviors.
This analytical approach is crucial in various fields, from product development to process improvement , and even in understanding complex social phenomena.
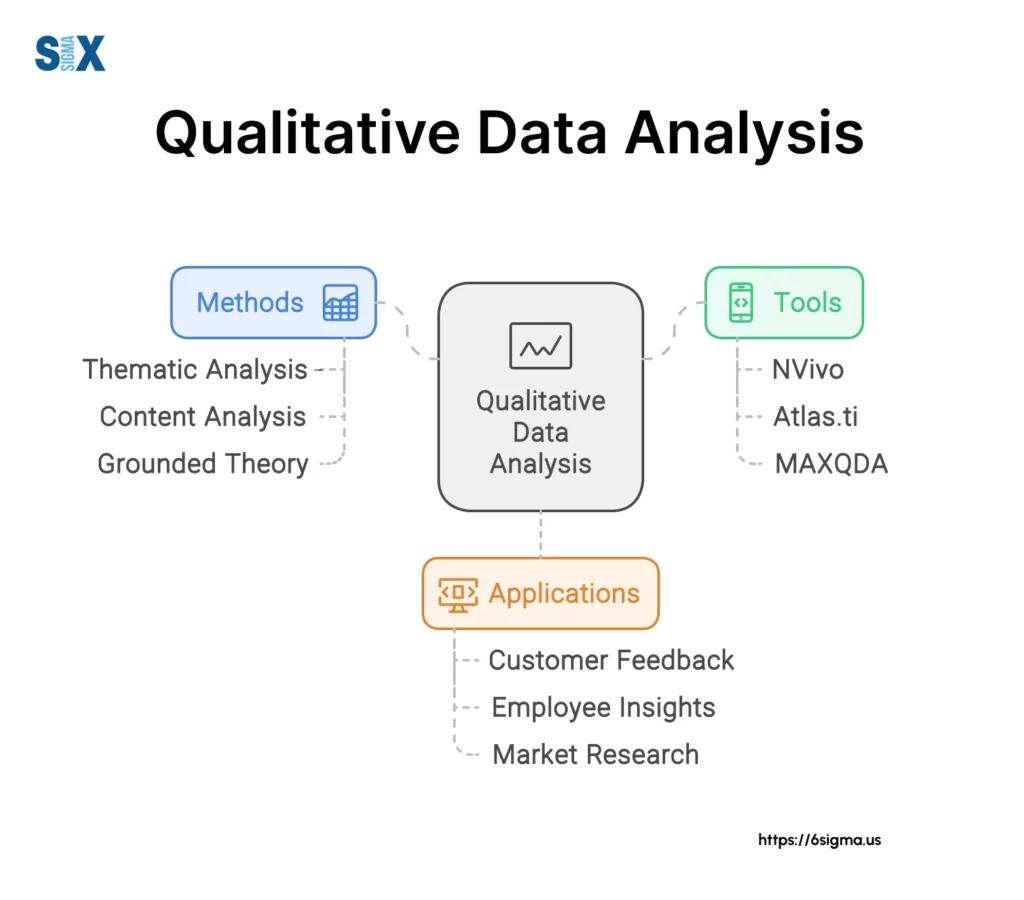
Importance of Qualitative Research Methods
The importance of qualitative research methods cannot be overstated. In my work with companies like 3M , Dell , and Intel , I’ve seen how qualitative analysis can uncover insights that numbers alone simply can’t reveal.
These methods allow us to understand the ‘why’ behind the ‘what’, providing context and depth to our understanding of complex issues.
Whether it’s improving a manufacturing process or developing a new product, qualitative research methods offer a rich, nuanced perspective that’s invaluable for informed decision-making.
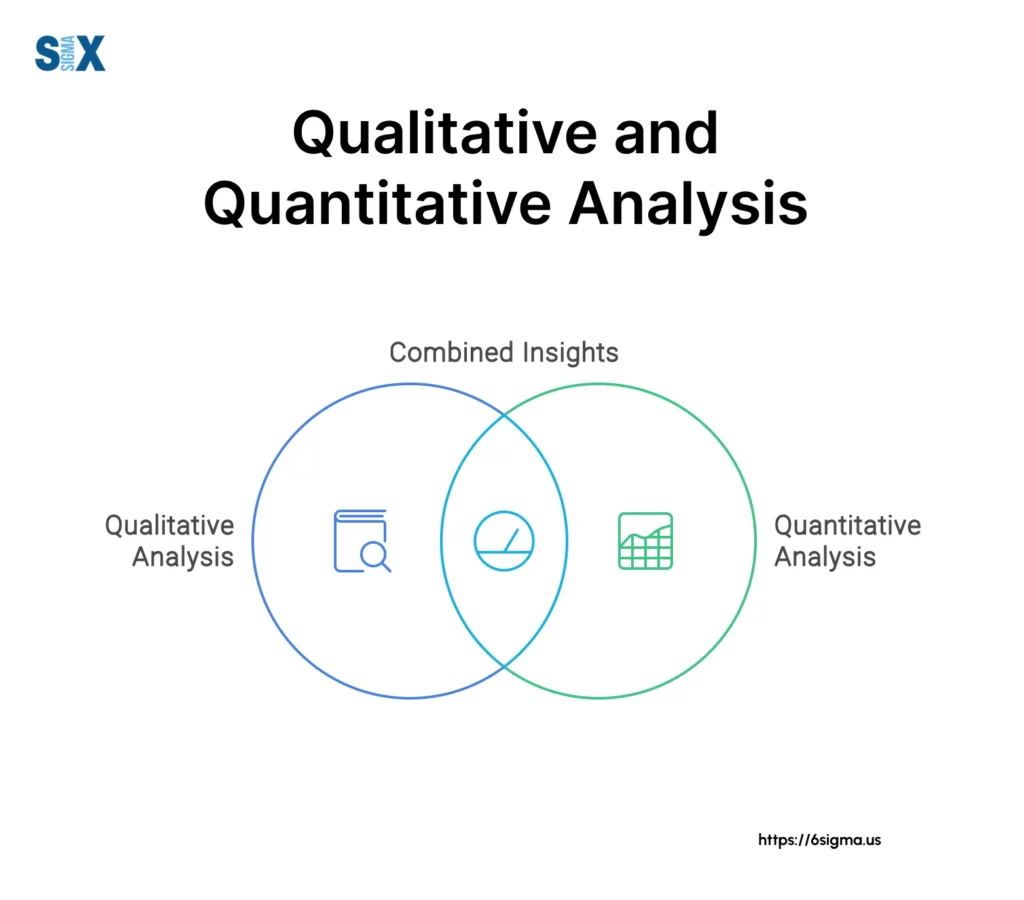
Comparing Qualitative vs Quantitative Analysis
While both qualitative and quantitative analyses are essential tools in a researcher’s arsenal, they serve different purposes.
Quantitative analysis, which I’ve extensively used in Six Sigma projects, deals with numerical data and statistical methods.
It’s excellent for measuring, ranking, and categorizing phenomena. On the other hand, qualitative analysis focuses on the rich, contextual data that can’t be easily quantified.
It’s about understanding meanings, experiences, and perspectives.
Key Approaches in Qualitative Data Analysis
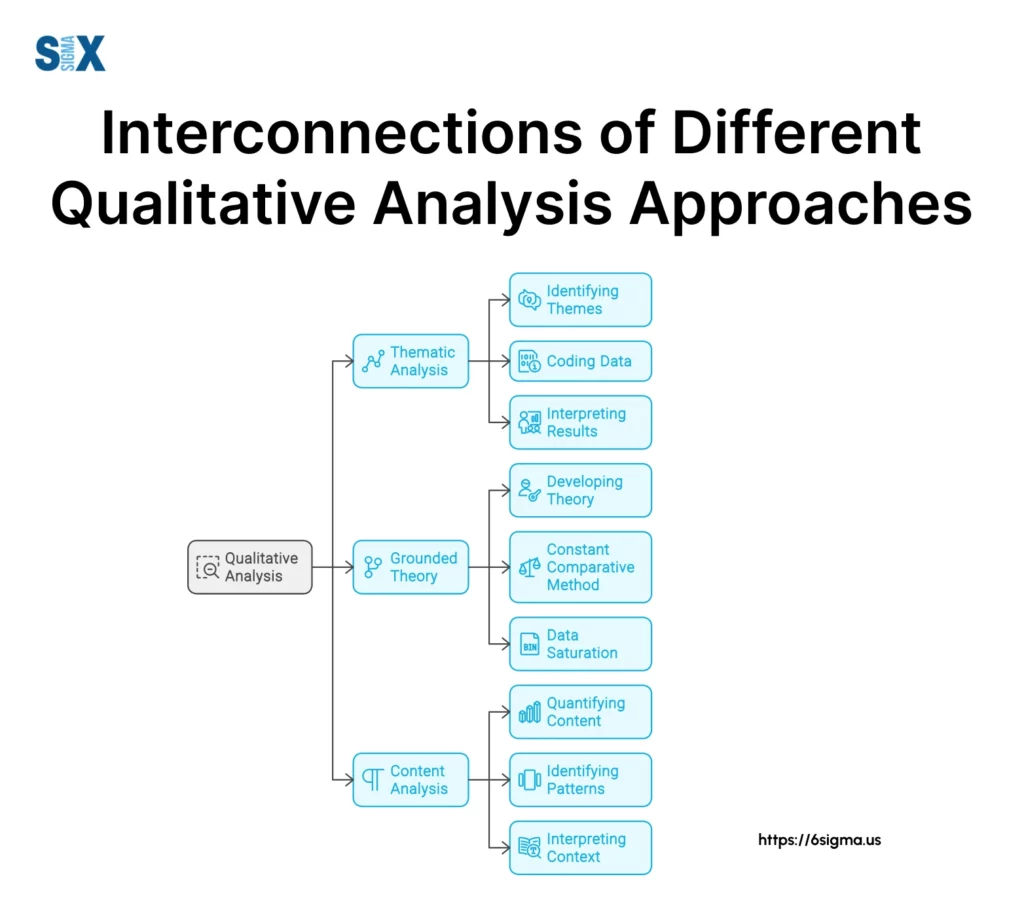
Explore essential techniques like thematic analysis, grounded theory, content analysis, and discourse analysis.
Understand how each approach offers unique insights into qualitative data interpretation and theory building.
Thematic Analysis Techniques
Thematic analysis is a cornerstone of qualitative data analysis. It involves identifying patterns or themes within qualitative data.
In my workshops on Statistical Thinking and Business Process Charting , I often emphasize the power of thematic analysis in uncovering underlying patterns in complex datasets.
This approach is particularly useful when dealing with interview transcripts or open-ended survey responses.
The key is to immerse yourself in the data, coding it systematically, and then stepping back to see the broader themes emerge.
Grounded Theory Methodology
Grounded theory is another powerful approach in qualitative data analysis. Unlike methods that start with a hypothesis, grounded theory allows theories to emerge from the data itself.
I’ve found this particularly useful in projects where we’re exploring new territory without preconceived notions.
It’s a systematic yet flexible approach that can lead to fresh insights and innovative solutions.
The iterative nature of grounded theory, with its constant comparison of data, aligns well with the continuous improvement philosophy of Six Sigma .
Content Analysis Strategies
Content analysis is a versatile method that can be both qualitative and quantitative.
In my experience working with diverse industries, content analysis has been invaluable in making sense of large volumes of textual data.
Whether it’s analyzing customer feedback or reviewing technical documentation, content analysis provides a structured way to categorize and quantify qualitative information.
The key is to develop a robust coding framework that captures the essence of your research questions.
Discourse Analysis Approaches
Discourse analysis takes a deeper look at language use and communication practices.
It’s not just about what is said, but how it’s said and in what context. In my work on improving communication processes within organizations , discourse analysis has been a powerful tool.
It helps uncover underlying assumptions, power dynamics, and cultural nuances that might otherwise go unnoticed.
This approach is particularly useful when dealing with complex organizational issues or when trying to understand stakeholder perspectives in depth.
The Qualitative Data Analysis Process
Navigate through data collection, coding techniques, theme development, and interpretation. Learn how to transform raw qualitative data into meaningful insights through systematic analysis.
Data collection methods (interviews, focus groups, observation)
The foundation of any good qualitative analysis lies in robust data collection. In my experience, a mix of methods often yields the best results.
In-depth interviews provide individual perspectives, focus groups offer insights into group dynamics, and observation allows us to see behaviors in their natural context.
When working on process improvement projects , I often combine these methods to get a comprehensive view of the situation.
The key is to align your data collection methods with your research questions and the nature of the information you’re seeking.
Qualitative Data Coding Techniques
Coding is the heart of qualitative data analysis. It’s the process of labeling and organizing your qualitative data to identify different themes and the relationships between them.
In my workshops, I emphasize the importance of developing a clear, consistent coding system.
This might involve open coding to identify initial concepts, axial coding to make connections between categories, and selective coding to integrate and refine the theory.
The goal is to transform raw data into meaningful, analyzable units.
Developing Themes and Patterns
Once your data is coded, the next step is to look for overarching themes and patterns. This is where the analytical magic happens.
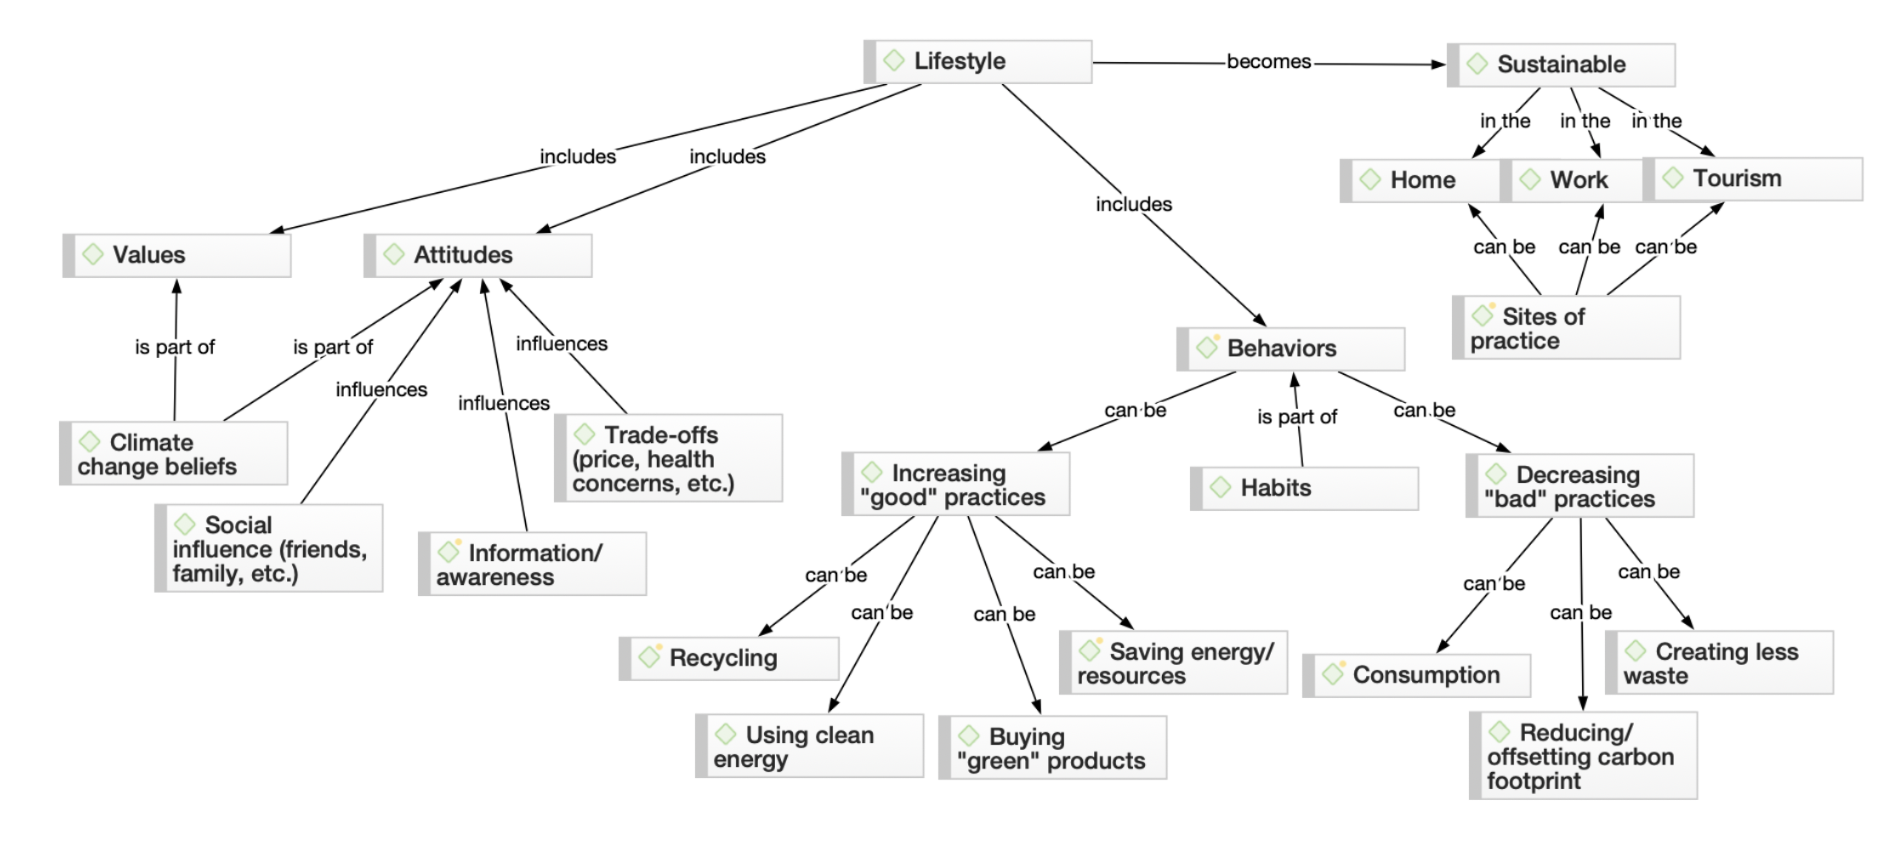
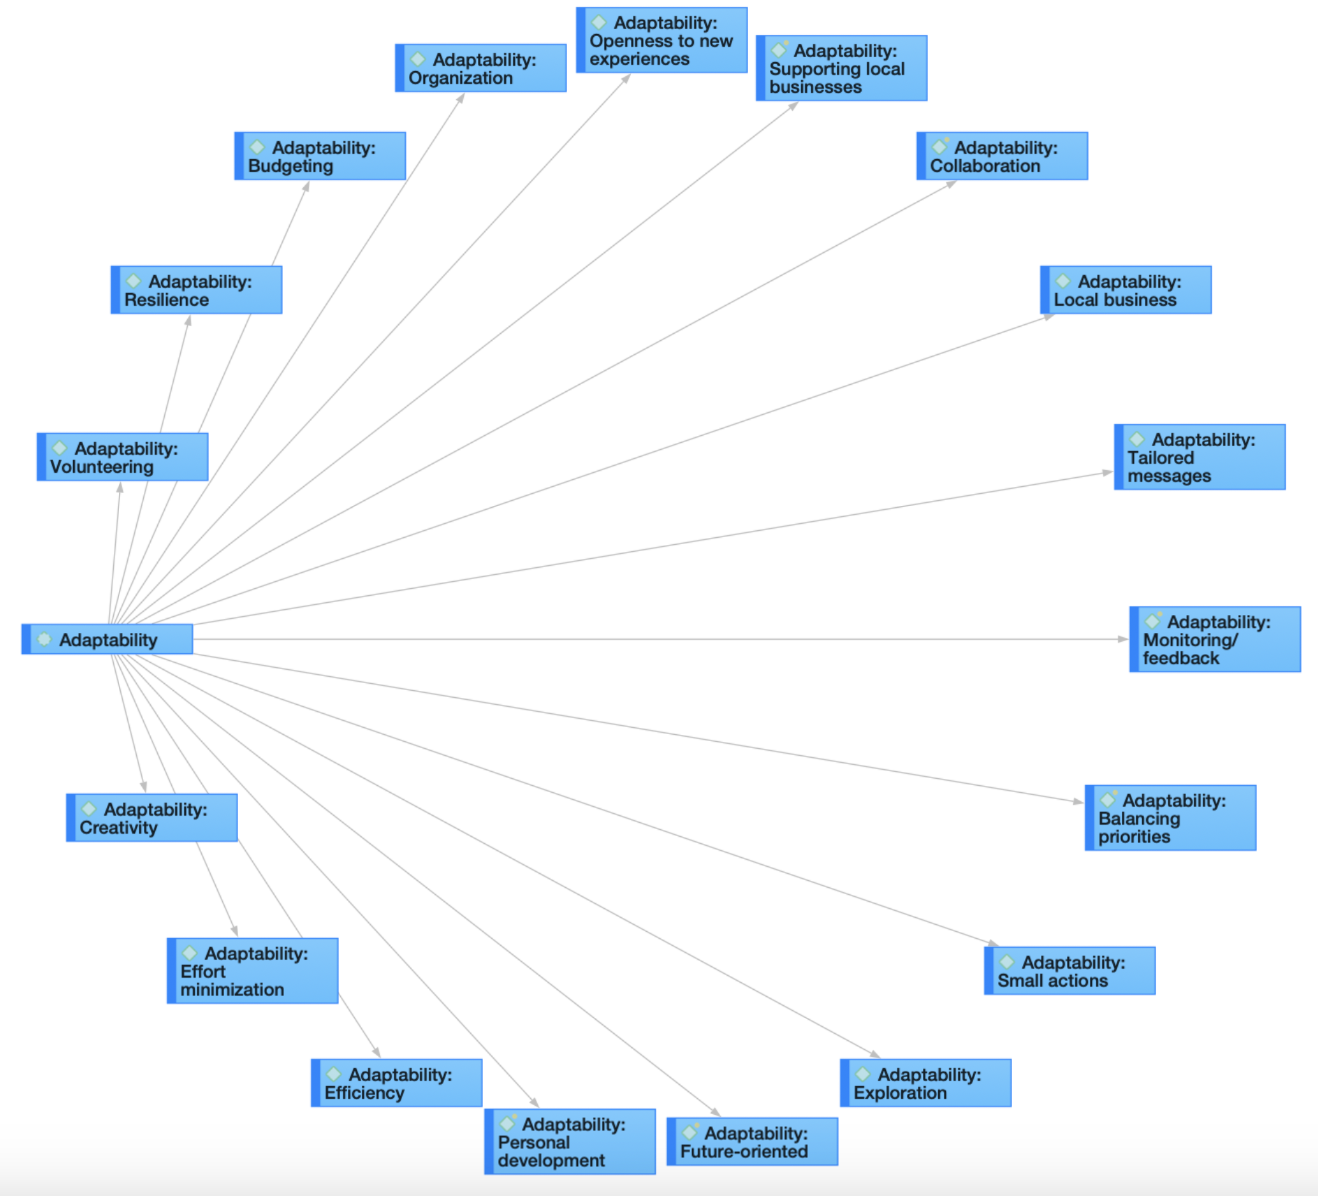
It’s about stepping back from the details and seeing the bigger picture. In my work with companies like Motorola and HP, I’ve found that visual tools like mind maps or thematic networks can be incredibly helpful in this process.
They allow you to see connections and hierarchies within your data that might not be immediately apparent in text form.
Data Interpretation and Theory Building
The final step in the qualitative data analysis process is interpretation and theory building.
This is where you bring together your themes and patterns to construct a coherent narrative or theory that answers your research questions.
It’s crucial to remain grounded in your data while also being open to new insights. In my experience, the best interpretations often challenge our initial assumptions and lead to innovative solutions.
Tools and Software for Qualitative Analysis
Discover the power of CAQDAS in streamlining qualitative data analysis workflows. Explore popular tools like NVivo, ATLAS.ti, and MAXQDA for efficient data management and analysis .
Overview of CAQDAS (Computer Assisted Qualitative Data Analysis Software)
Computer Assisted Qualitative Data Analysis Software (CAQDAS) has revolutionized the way we approach qualitative analysis.
These tools streamline the coding process, help manage large datasets, and offer sophisticated visualization options.
As someone who’s seen the evolution of these tools over the past two decades, I can attest to their transformative power.
They allow researchers to handle much larger datasets and perform more complex analyses than ever before.
Popular Tools: NVivo, ATLAS.ti, MAXQDA
Among the most popular CAQDAS tools are NVivo, ATLAS.ti, and MAXQDA.
Each has its strengths, and the choice often depends on your specific needs and preferences. NVivo , for instance, offers robust coding capabilities and is excellent for managing multimedia data.
ATLAS.ti is known for its intuitive interface and powerful network view feature. MAXQDA stands out for its mixed methods capabilities, blending qualitative and quantitative approaches seamlessly.
Ensuring Rigor in Qualitative Data Analysis
Implement strategies like data triangulation, member checking, and audit trails to enhance credibility. Understand the importance of reflexivity in maintaining objectivity throughout the research process.
Data triangulation methods
Ensuring rigor in qualitative analysis is crucial for producing trustworthy results.
Data triangulation is a powerful method for enhancing the credibility of your findings. It involves using multiple data sources, methods, or investigators to corroborate your results.
In my Six Sigma projects, I often employ methodological triangulation, combining interviews, observations, and document analysis to get a comprehensive view of a process or problem.
Member Checking for Validity
Member checking is another important technique for ensuring the validity of your qualitative analysis.
This involves taking your findings back to your participants to confirm that they accurately represent their experiences and perspectives.
In my work with various organizations, I’ve found that this not only enhances the credibility of the research but also often leads to new insights as participants reflect on the findings.
Creating an Audit Trail
An audit trail is essential for demonstrating the rigor of your qualitative analysis.
It’s a detailed record of your research process, including your raw data, analysis notes, and the evolution of your coding scheme.
Practicing Reflexivity
Reflexivity is about acknowledging and critically examining your own role in the research process. As researchers, we bring our own biases and assumptions to our work.
Practicing reflexivity involves constantly questioning these assumptions and considering how they might be influencing our analysis.
Challenges and Best Practices in Qualitative Data Analysis
Address common hurdles such as data saturation , researcher bias, and ethical considerations. Learn best practices for conducting rigorous and ethical qualitative research in various contexts.
Dealing with data saturation
One of the challenges in qualitative research is knowing when you’ve reached data saturation – the point at which new data no longer brings new insights.
In my experience, this requires a balance of systematic analysis and intuition. It’s important to continuously review and compare your data as you collect it.
In projects I’ve led, we often use data matrices or summary tables to track emerging themes and identify when we’re no longer seeing new patterns emerge.
Overcoming Researcher Bias
Researcher bias is an ever-present challenge in qualitative analysis. Our own experiences and preconceptions can inadvertently influence how we interpret data.
To overcome this, I advocate for a combination of strategies. Regular peer debriefing sessions , where you discuss your analysis with colleagues, can help uncover blind spots.
Additionally, actively seeking out negative cases or contradictory evidence can help challenge your assumptions and lead to more robust findings.
Ethical Considerations in Qualitative Research
Ethical considerations are paramount in qualitative research, given the often personal and sensitive nature of the data.
Protecting participant confidentiality, ensuring informed consent, and being transparent about the research process are all crucial.
In my work across various industries and cultures, I’ve learned the importance of being sensitive to cultural differences and power dynamics.
It’s also vital to consider the potential impact of your research on participants and communities.
Ethical qualitative research is not just about following guidelines, but about constantly reflecting on the implications of your work.
The Future of Qualitative Data Analysis
As we look to the future of qualitative data analysis, several exciting trends are emerging.
The increasing use of artificial intelligence and machine learning in qualitative analysis tools promises to revolutionize how we handle large datasets.
We’re also seeing a growing interest in visual and sensory methods of data collection and analysis, expanding our understanding of qualitative data beyond text.
In conclusion, mastering qualitative data analysis is an ongoing journey. It requires a combination of rigorous methods, creative thinking, and ethical awareness.
As we move forward, the field will undoubtedly continue to evolve, but its fundamental importance in research and decision-making will remain constant.
For those willing to dive deep into the complexities of qualitative data, the rewards in terms of insights and understanding are immense.
SixSigma.us offers both Live Virtual classes as well as Online Self-Paced training. Most option includes access to the same great Master Black Belt instructors that teach our World Class in-person sessions. Sign-up today!
Virtual Classroom Training Programs Self-Paced Online Training Programs
SixSigma.us Accreditation & Affiliations

Monthly Management Tips
- Be the first one to receive the latest updates and information from 6Sigma
- Get curated resources from industry-experts
- Gain an edge with complete guides and other exclusive materials
- Become a part of one of the largest Six Sigma community
- Unlock your path to become a Six Sigma professional
" * " indicates required fields

IMAGES
VIDEO